Chevron 2009 Annual Report Download - page 75
Download and view the complete annual report
Please find page 75 of the 2009 Chevron annual report below. You can navigate through the pages in the report by either clicking on the pages listed below, or by using the keyword search tool below to find specific information within the annual report.-
 1
1 -
2
-
3
-
4
-
5
-
6
-
7
-
8
-
9
-
10
-
11
-
12
-
13
-
14
-
15
-
16
-
17
-
18
-
19
-
20
-
21
-
22
-
23
-
24
-
25
-
26
-
27
-
28
-
29
-
30
-
31
-
32
-
33
-
34
-
35
-
36
-
37
-
38
-
39
-
40
-
41
-
42
-
43
-
44
-
45
-
46
-
47
-
48
-
49
-
50
-
51
-
52
-
53
-
54
-
55
-
56
-
57
-
58
-
59
-
60
-
61
-
62
-
63
-
64
-
 65
65 -
 66
66 -
 67
67 -
 68
68 -
 69
69 -
 70
70 -
 71
71 -
 72
72 -
 73
73 -
 74
74 -
 75
75 -
 76
76 -
 77
77 -
 78
78 -
 79
79 -
 80
80 -
 81
81 -
 82
82 -
 83
83 -
 84
84 -
 85
85 -
86
-
87
-
88
-
89
-
90
-
91
-
92
 |
 |

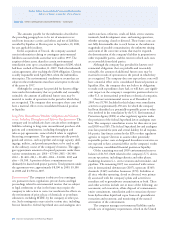
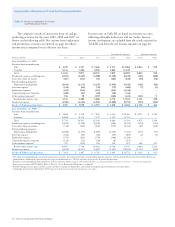
Chevron Corporation 2009 Annual Report 73
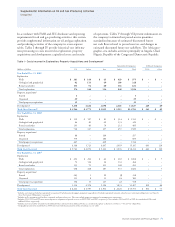
Consolidated Companies Affiliated Companies
Millions of dollars U.S. Africa Asia Other Total TCO Other
At Dec. 31, 20072,3
Unproved properties $ 2,050 $ 314 $ 3,125 $ 1,159 $ 6,648 $ 112 $ –
Proved properties and related producing assets 44,088 11,894 23,100 13,286 92,368 4,247 1,127
Support equipment 637 850 1,355 491 3,333 758 –
Deferred exploratory wells 413 368 214 665 1,660 – –
Other uncompleted projects 4,009 6,430 2,039 2,024 14,502 1,633 55
Gross Capitalized Costs 51,197 19,856 29,833 17,625 118,511 6,750 1,182
Unproved properties valuation 833 201 120 567 1,721 23 –
Proved producing properties –
Depreciation and depletion 30,097 5,427 11,329 8,237 55,090 644 183
Support equipment depreciation 349 464 678 298 1,789 267 –
Accumulated provisions 31,279 6,092 12,127 9,102 58,600 934 183
Net Capitalized Costs $ 19,918 $13,764 $17,706 $ 8,523 $ 59,911 $ 5,816 $ 999
2 Geographic presentation conformed to 2009 consistent with the presentation of the oil and gas reserve tables.
3 Amounts for Affiliated Companies – Other conformed to agreements entered in 2007 and 2008 for Venezuelan affiliates.
Table II Capitalized Costs Related to Oil and
Gas Producing Activities – Continued