Chevron 2009 Annual Report Download - page 17
Download and view the complete annual report
Please find page 17 of the 2009 Chevron annual report below. You can navigate through the pages in the report by either clicking on the pages listed below, or by using the keyword search tool below to find specific information within the annual report.-
 1
1 -
2
-
3
-
4
-
5
-
6
-
 7
7 -
 8
8 -
 9
9 -
 10
10 -
 11
11 -
 12
12 -
 13
13 -
 14
14 -
 15
15 -
 16
16 -
 17
17 -
 18
18 -
 19
19 -
 20
20 -
 21
21 -
 22
22 -
 23
23 -
 24
24 -
 25
25 -
 26
26 -
 27
27 -
28
-
29
-
30
-
31
-
32
-
33
-
34
-
35
-
36
-
37
-
38
-
39
-
40
-
41
-
42
-
43
-
44
-
45
-
46
-
47
-
48
-
49
-
50
-
51
-
52
-
53
-
54
-
55
-
56
-
57
-
58
-
59
-
60
-
61
-
62
-
63
-
64
-
65
-
66
-
67
-
68
-
69
-
70
-
71
-
72
-
73
-
74
-
75
-
76
-
77
-
78
-
79
-
80
-
81
-
82
-
83
-
84
-
85
-
86
-
87
-
88
-
89
-
90
-
91
-
92
 |
 |

Chevron Corporation 2009 Annual Report 15
FS-PB
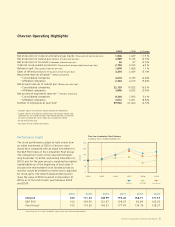
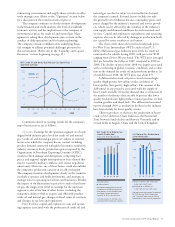
Net oil-equivalent production in 2009 averaged
717,000 barrels per day, up 6.9 percent from 2008 and
down 3.5 percent from 2007. The increase between 2008
and 2009 was mainly due to the start-up of the Blind Faith
Field in late 2008 and the Tahiti Field in the second quarter
2009. The decrease between 2007 and 2008 was mainly
due to normal field declines and the adverse impact of the
hurricanes. The net liquids component of oil-equivalent
production for 2009 averaged 484,000 barrels per day, up
approximately 15 percent from 2008 and 5 percent compared
with 2007. Net natural-gas production averaged 1.4 billion
cubic feet per day in 2009, down approximately 7 percent
from 2008 and about 18 percent from 2007.
Refer to the “Selected Operating Data” table on page
18 for the three-year comparative production volumes in
the United States.
International Upstream – Exploration and Production
Millions of dollars 2009 2008 2007
Earnings* $ 8,215 $ 14,584 $ 10,284
*Includes foreign currency effects: $ (571) $ 873 $ (417)
International upstream earnings of $8.2 billion in 2009
decreased $6.4 billion from 2008. Lower prices for crude oil
and natural gas reduced earnings by $7.0 billion, while for-
eign-currency effects and higher operating and depreciation
expenses decreased income by a total of $2.2 billion. Partially
offsetting these items were benefits of $2.3 billion result-
ing from an increase in sales volumes of crude oil and about
$500 million associated with asset sales and tax items related
to the Gorgon Project in Australia.
Earnings of $14.6 billion in 2008 increased $4.3 bil-
lion from 2007. Higher prices for crude oil and natural gas
increased earnings by $4.9 billion. Partially offsetting the
benefit of higher prices was an impact of about $1.8 billion
associated with a reduction of crude-oil sales volumes due to
timing of certain cargo liftings and higher depreciation and
operating expenses. Foreign-currency effects benefited earn-
ings by $873 million in 2008, compared with a reduction to
earnings of $417 million in 2007.
The company’s average realization for crude oil and
natural gas liquids in 2009 was $55.97 per barrel, compared
with $86.51 in 2008 and $65.01 in 2007. The average
natural-gas realization was $4.01 per thousand cubic feet in
2009, compared with $5.19 and $3.90 in 2008 and 2007,
respectively.
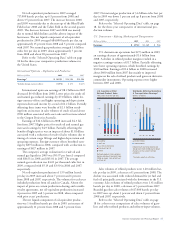
Net oil-equivalent production of 1.99 million barrels
per day in 2009 increased about 7 percent and 6 percent
from 2008 and 2007, respectively. The volumes for each year
included production from oil sands in Canada. Absent the
impact of prices on certain production-sharing and variable-
royalty agreements, net oil-equivalent production increased
4 percent in 2009 and 3 percent in 2008, when compared
with prior years’ production.
The net liquids component of oil-equivalent produc-
tion was 1.4 million barrels per day in 2009, an increase of
approximately 11 percent from 2008 and 5 percent from
2007. Net natural-gas production of 3.6 billion cubic feet per
day in 2009 was down 1 percent and up 8 percent from 2008
and 2007, respectively.
Refer to the “Selected Operating Data” table, on page
18, for the three-year comparative of international pro -
duction volumes.
U.S. Downstream – Refining, Marketing and Transportation
Millions of dollars 2009 2008 2007
Earnings $ (273) $ 1,369 $ 966
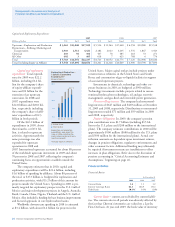
U.S. downstream operations lost $273 million in 2009,
an earnings decrease of approximately $1.6 billion from
2008. A decline in refined product margins resulted in a
negative earnings variance of $1.7 billion. Partially offsetting
were lower operating expenses, which benefited earnings by
$300 million. Earnings of $1.4 billion in 2008 increased
about $400 million from 2007 due mainly to improved
margins on the sale of refined products and gains on derivative
commodity instruments. Operating expenses were higher
between 2007 and 2008.
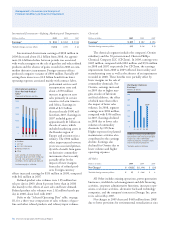
Sales volumes of refined products were 1.40 million bar-
rels per day in 2009, a decrease of 1 percent from 2008. The
decline was associated with reduced demand for jet fuel and
fuel oil, principally associated with the downturn in the U.S.
economy. Sales volumes of refined products were 1.41 million
barrels per day in 2008, a decrease of 3 percent from 2007.
Branded gasoline sales volumes of 617,000 barrels per day
in 2009 were up about 3 percent and down 2 percent from
2008 and 2007, respectively.
Refer to the “Selected Operating Data” table on page
18 for a three-year comparison of sales volumes of gaso -
line and other refined products and refinery-input volumes.
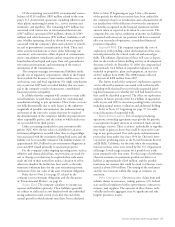
0
160 0
120 0
800
400
#018 – U.S. Gas & Other Rened
Prod Sales – v1
U.S. Gasoline & Other
Rened-Product Sales
Thousands of barrels per day
Gasoline
Jet Fuel
Gas Oils & Kerosene
Residual Fuel Oil
Other
Refined-product sales volumes
decreased about 1 percent from
2008 on lower sales of jet fuel
and fuel oil.
1,403
0605 07 08 09
Downstream earnings decreased
84 percent from 2008 due to lower
margins on the sale of refined
products.
*Includes equity in affiliates
United States
International
-0.5
4.5
3.5
2.5
0.5
1.5
Worldwide Rening, Marketing
& Transportation Earnings*
Billions of dollars
$0.6
0605 07 08 09
#019 – WW Rening, Marketing &
Trans Earnings – v3