Chevron 2009 Annual Report Download - page 53
Download and view the complete annual report
Please find page 53 of the 2009 Chevron annual report below. You can navigate through the pages in the report by either clicking on the pages listed below, or by using the keyword search tool below to find specific information within the annual report.-
 1
1 -
2
-
3
-
4
-
5
-
6
-
7
-
8
-
9
-
10
-
11
-
12
-
13
-
14
-
15
-
16
-
17
-
18
-
19
-
20
-
21
-
22
-
23
-
24
-
25
-
26
-
27
-
28
-
29
-
30
-
31
-
32
-
33
-
34
-
35
-
36
-
37
-
38
-
39
-
40
-
41
-
42
-
 43
43 -
 44
44 -
 45
45 -
 46
46 -
 47
47 -
 48
48 -
 49
49 -
 50
50 -
 51
51 -
 52
52 -
 53
53 -
 54
54 -
 55
55 -
 56
56 -
 57
57 -
 58
58 -
 59
59 -
 60
60 -
 61
61 -
 62
62 -
 63
63 -
64
-
65
-
66
-
67
-
68
-
69
-
70
-
71
-
72
-
73
-
74
-
75
-
76
-
77
-
78
-
79
-
80
-
81
-
82
-
83
-
84
-
85
-
86
-
87
-
88
-
89
-
90
-
91
-
92
 |
 |

Chevron Corporation 2009 Annual Report 51
FS-PB
Note 11 Lease Commitments – Continued
the fair value of Chevron’s share of CAL common stock was
approximately $1,120.
Colonial Pipeline Company Chevron owns an approximate
23 percent equity interest in the Colonial Pipeline Company.
The Colonial Pipeline system runs from Texas to New Jersey
and transports petroleum products in a 13-state market. At
December 31, 2009, the company’s carrying value of its invest-
ment in Colonial Pipeline was approximately $550 higher
than the amount of underlying equity in Colonial Pipeline
net assets. This difference primarily relates to purchase price
adjustments from the acquisition of Unocal Corporation.
Chevron Phillips Chemical Company LLC Chevron owns
50 percent of Chevron Phillips Chemical Company LLC.
The other half is owned by Conoco Phillips Corporation.
Note 12 Investments and Advances – Continued
Other Information “Sales and other operating revenues” on the
Consolidated Statement of Income includes $10,391, $15,390
and $11,555 with affiliated companies for 2009, 2008 and
2007, respectively. “Purchased crude oil and products” includes
$4,631, $6,850 and $5,464 with affiliated companies for 2009,
2008 and 2007, respectively.
“Accounts and notes receivable” on the Consolidated
Balance Sheet includes $1,125 and $701 due from affiliated
companies at December 31, 2009 and 2008, respectively.
“Accounts payable” includes $345 and $289 due to affiliated
companies at December 31, 2009 and 2008, respectively.
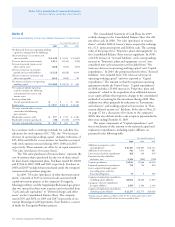
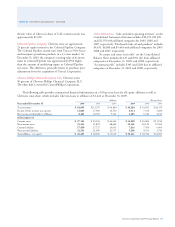
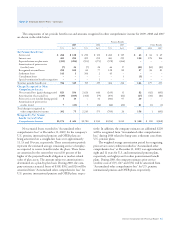
The following table provides summarized financial information on a 100 percent basis for all equity affiliates as well as
Chevron’s total share, which includes Chevron loans to affiliates of $2,422 at December 31, 2009.
Affiliates Chevron Share
Year ended December 31 2009 2008 2007 2009 2008 2007
Tot a l re venues $ 81,995 $ 112,707 $ 94,864 $ 39,280 $ 54,055 $ 46,579
Income before income tax expense 11,083 17,500 12,510 4,511 7,532 5,836
Net income attributable to affiliates 8,261 12,705 9,743 3,285 5,524 4,550
At December 31
Current assets $ 27,111 $ 25,194 $ 26,360 $ 11,009 $ 10,804 $ 11,914
Noncurrent assets 55,363 51,878 48,440 21,361 20,129 19,045
Current liabilities 17,450 17,727 19,033 7,833 7,474 9,009
Noncurrent liabilities 21,531 21,049 22,757 5,106 4,533 3,745
Total affiliates’ net equity $ 43,493 $ 38,296 $ 33,010 $ 19,431 $ 18,926 $ 18,205