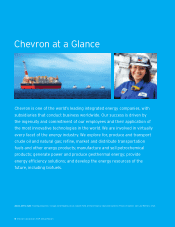
Chevron 2009 Annual Report Download - page 14
Download and view the complete annual report
Please find page 14 of the 2009 Chevron annual report below. You can navigate through the pages in the report by either clicking on the pages listed below, or by using the keyword search tool below to find specific information within the annual report.-
 1
1 -
2
-
3
-
 4
4 -
 5
5 -
 6
6 -
 7
7 -
 8
8 -
 9
9 -
 10
10 -
 11
11 -
 12
12 -
 13
13 -
 14
14 -
 15
15 -
 16
16 -
 17
17 -
 18
18 -
 19
19 -
 20
20 -
 21
21 -
 22
22 -
 23
23 -
 24
24 -
25
-
26
-
27
-
28
-
29
-
30
-
31
-
32
-
33
-
34
-
35
-
36
-
37
-
38
-
39
-
40
-
41
-
42
-
43
-
44
-
45
-
46
-
47
-
48
-
49
-
50
-
51
-
52
-
53
-
54
-
55
-
56
-
57
-
58
-
59
-
60
-
61
-
62
-
63
-
64
-
65
-
66
-
67
-
68
-
69
-
70
-
71
-
72
-
73
-
74
-
75
-
76
-
77
-
78
-
79
-
80
-
81
-
82
-
83
-
84
-
85
-
86
-
87
-
88
-
89
-
90
-
91
-
92
 |
 |

Management’s Discussion and Analysis of
Financial Condition and Results of Operations
12 Chevron Corporation 2009 Annual Report
FS-PB
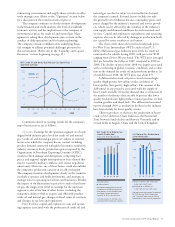
sector of the North Sea. (See page 18 for the company’s
average U.S. and international crude-oil realizations.)
In contrast to price movements in the global market
for crude oil, price changes for natural gas in many regional
markets are more closely aligned with supply-and-demand
conditions in those markets. In the United States, prices at
Henry Hub averaged about $3.80 per thousand cubic feet
(MCF) during 2009, compared with almost $9 during 2008.
At December 31, 2009, and as of mid-February 2010, the
Henry Hub spot price was about $5.70 and $5.50 per MCF,
respectively. Fluctuations in the price for natural gas in the
United States are closely associated with customer demand rel-
ative to the volumes produced in North America and the level
of inventory in underground storage. Weaker U.S. demand in
2009 was associated with the economic slowdown.
Certain international natural-gas markets in which the
company operates have different supply, demand and regula-
tory circumstances, which historically have resulted in lower
average sales prices for the company’s production of natural
gas in these locations. Chevron continues to invest in long-
term projects in these locations to install infrastructure to
produce and liquefy natural gas for transport by tanker to
other markets where greater demand results in higher prices.
International natural-gas realizations averaged about $4.00
per MCF during 2009, compared with about $5.20 per MCF
during 2008. Unlike prior years, these realizations com-
pared favorably with those in the United States during 2009,
primarily as a result of the deterioration of U.S. supply-and-
demand conditions resulting from the economic slowdown.
(See page 18 for the company’s average natural gas real-
izations for the U.S. and international regions.)
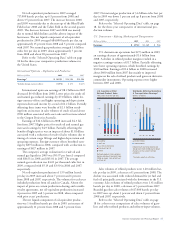
The company’s worldwide net oil-equivalent production
in 2009 averaged 2.70 million barrels per day. About one-
fifth of the company’s net oil-equivalent production in 2009
occurred in the OPEC-member countries of Angola, Nigeria
and Venezuela and in the Partitioned Zone between Saudi
Arabia and Kuwait. For the year 2009, the company’s net oil
production was reduced by an average of 20,000 barrels per
day due to quotas imposed by OPEC. All of the imposed cur-
tailments took place during the first half of the year. At the
December 2009 meeting, members of OPEC supported main-
taining production quotas in effect since December 2008.
The company estimates that oil-equivalent production
in 2010 will average approximately 2.73 million barrels per
day. This estimate is subject to many factors and uncertain-
ties, including additional quotas that may be imposed by
OPEC, price effects on production volumes calculated under
cost-recovery and variable-royalty provisions of certain con-
tracts, changes in fiscal terms or restrictions on the scope of
company operations, delays in project startups, fluctuations
in demand for natural gas in various markets, weather con-
ditions that may shut in production, civil unrest, changing
geopolitics, or other disruptions to operations. The outlook
for future production levels is also affected by the size and
number of economic investment opportunities and, for new
large-scale projects, the time lag between initial exploration
and the beginning of production. Investments in upstream
projects generally begin well in advance of the start of the
associated crude-oil and natural-gas production. A significant
majority of Chevron’s upstream investment is made outside
the United States.
Refer to the “Results of Operations” section on pages
14 through 15 for additional discussion of the company’s
upstream business.
Refer to Table V beginning on page 76 for a tabu-
lation of the company’s proved net oil and gas reserves by
geographic area, at the beginning of 2007 and each year-end
from 2007 through 2009, and an accompanying discussion
of major changes to proved reserves by geographic area for
the three-year period ending December 31, 2009.
Downstream Earnings for the downstream segment
are closely tied to margins on the refining and marketing
of products that include gasoline, diesel, jet fuel, lubricants,
fuel oil and feedstocks for chemical manufacturing. Industry
margins are sometimes volatile and can be affected by the
global and regional supply-and-demand balance for refined
products and by changes in the price of crude oil used for
refinery feedstock. Industry margins can also be influenced
by refined-product inventory levels, geopolitical events, cost
of materials and services, refinery maintenance programs and
disruptions at refineries resulting from unplanned outages
due to severe weather, fires or other operational events.
Other factors affecting profitability for downstream
operations include the reliability and efficiency of the compa-
ny’s refining and marketing network and the effectiveness of
the crude-oil and product-supply functions. Profitability can
also be affected by the volatility of tanker-charter rates for
the company’s shipping operations, which are driven by the
industry’s demand for crude-oil and product tankers. Other
factors beyond the company’s control include the general
level of inflation and energy costs to operate the company’s
refinery and distribution network.
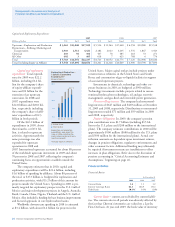
The company’s most significant marketing areas are the
West Coast of North America, the U.S. Gulf Coast, Latin
America, Asia, southern Africa and the United Kingdom.
Chevron operates or has significant ownership interests in refin-
eries in each of these areas except Latin America. The company
completed sales of marketing businesses during 2009 in certain
countries in Latin America and Africa. The company plans
to discontinue, by mid-2010, sales of Chevron- and Texaco-
branded motor fuels in the mid-Atlantic and other eastern
states, where the company sold to retail customers through
approximately 1,100 stations and to commercial and industrial
customers through supply arrangements. Sales in these markets