Chevron 2009 Annual Report Download - page 83
Download and view the complete annual report
Please find page 83 of the 2009 Chevron annual report below. You can navigate through the pages in the report by either clicking on the pages listed below, or by using the keyword search tool below to find specific information within the annual report.-
 1
1 -
2
-
3
-
4
-
5
-
6
-
7
-
8
-
9
-
10
-
11
-
12
-
13
-
14
-
15
-
16
-
17
-
18
-
19
-
20
-
21
-
22
-
23
-
24
-
25
-
26
-
27
-
28
-
29
-
30
-
31
-
32
-
33
-
34
-
35
-
36
-
37
-
38
-
39
-
40
-
41
-
42
-
43
-
44
-
45
-
46
-
47
-
48
-
49
-
50
-
51
-
52
-
53
-
54
-
55
-
56
-
57
-
58
-
59
-
60
-
61
-
62
-
63
-
64
-
65
-
66
-
67
-
68
-
69
-
70
-
71
-
72
-
 73
73 -
 74
74 -
 75
75 -
 76
76 -
 77
77 -
 78
78 -
 79
79 -
 80
80 -
 81
81 -
 82
82 -
 83
83 -
 84
84 -
 85
85 -
 86
86 -
 87
87 -
 88
88 -
 89
89 -
 90
90 -
 91
91 -
 92
92
 |
 |

Chevron Corporation 2009 Annual Report 81
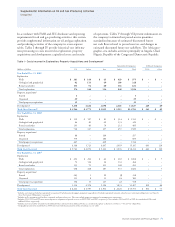
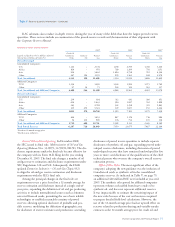
Table V Reserve Quantity Information – Continued
Noteworthy amounts in the categories of natural gas
proved-reserve changes for 2007 through 2009 are dis-
cussed below:
Revisions In 2007, net revisions increased reserves for
consolidated companies by 395 BCF and increased reserves
for affiliated companies by 73 BCF. For consolidated com-
panies, net increases of 346 BCF in Asia and 209 BCF in
the United States were partially offset by downward revi-
sions of 160 BCF in Africa and Other regions. In the Asia
region, drilling activities in Thailand added 360 BCF, which
were partially offset by downward revisions in Azerbaijan
and Kazakhstan due to the impact of higher prices. In the
United States, improved reservoir performance for many
fields contributed to the increase with the largest portion in
the mid-continent areas. Decreases in Africa were primarily
due to a 136 BCF downward revision in Nigeria resulting
from field performance. The Other regions had net down-
ward revisions of 19 BCF. A 185 BCF downward revision in
Australia due to drilling results and other smaller declines
were mostly offset by improved reservoir performance in
Trinidad and Tobago which added 188 BCF.
TCO had an upward revision of 75 BCF associated
with improved reservoir performance and development
activities. This upward revision was net of a negative impact
due to higher year-end prices on royalty determination.
In 2008, net revisions increased reserves for consolidated
companies by 1,166 BCF and increased reserves for affiliated
companies by 1,130 BCF. In the Asia region, positive revi-
sions totaled 1,073 BCF for consolidated companies. Almost
half of the increase was attributed to the Karachaganak Field
in Kazakhstan, due mainly to the effects of low year-end
prices on the production-sharing contract and the results of
development drilling and improved recovery. Other large
upward revisions were recorded for the Pattani Field in
Thailand due to a successful drilling campaign.
For the TCO affiliate in Kazakhstan, an increase of 498
BCF reflected the impacts of lower year-end prices on royalty
determination and facility optimization. Reserves associated
Net Proved Reserves of Natural Gas
Tota l
Consolidated
Consolidated Companies Affiliated Companies and Affiliated
Billions of cubic feet U.S. Africa Asia Other Total TCO Other Companies
Reserves at Jan 1, 2007 4,028 3,206 7,102 5,574 19,910 2,743 231 22,884
Changes attributable to:
Revisions 209 (141) 346 (19) 395 75 (2) 468
Improved recovery – – – 1 1 – – 1
Extensions and discoveries 86 11 358 63 518 – – 518
Purchases1 50 – 91 – 141 – 211 352
Sales3 (76) – – – (76) – (175) (251)
Production (620) (27) (690) (415) (1,752) (70) (10) (1,832)
Reserves at Dec. 31, 20072 3,677 3,049 7,207 5,204 19,137 2,748 255 22,140
Changes attributable to:
Revisions (28) 60 1,073 61 1,166 498 632 2,296
Improved recovery – – – – – – – –
Extensions and discoveries 108 – 23 1 132 – – 132
Purchases 66 – 441 – 507 – – 507
Sales3 (124) – – – (124) – – (124)
Production (549) (53) (748) (446) (1,796) (71) (9) (1,876)
Reserves at Dec. 31, 20082 3,150 3,056 7,996 4,820 19,022 3,175 878 23,075
Changes attributable to:
Revisions 39 4 493 33 569 (237) 193 525
Improved recovery – – – – – – – –
Extensions and discoveries 53 3 54 4,277 4,387 – – 4,387
Purchases – – – – – – – –
Sales (33) – – (84) (117) – – (117)
Production (511) (42) (683) (472) (1,708) (105) (8) (1,821)
Reserves at Dec. 31, 20092,4 2,698 3,021 7,860 8,574 22,153 2,833 1,063 26,049
1 Includes reserves acquired through nonmonetary transactions.
2 Includes year-end reserve quantities related to production-sharing contracts (PSC) (refer to page 8 for the definition of a PSC). PSC-related reserve quantities are 31 percent,
40 percent and 37 percent for consolidated companies for 2009, 2008 and 2007, respectively.
3 Includes reserves disposed of through nonmonetary transactions.