Chevron 2009 Annual Report Download - page 70
Download and view the complete annual report
Please find page 70 of the 2009 Chevron annual report below. You can navigate through the pages in the report by either clicking on the pages listed below, or by using the keyword search tool below to find specific information within the annual report.-
 1
1 -
2
-
3
-
4
-
5
-
6
-
7
-
8
-
9
-
10
-
11
-
12
-
13
-
14
-
15
-
16
-
17
-
18
-
19
-
20
-
21
-
22
-
23
-
24
-
25
-
26
-
27
-
28
-
29
-
30
-
31
-
32
-
33
-
34
-
35
-
36
-
37
-
38
-
39
-
40
-
41
-
42
-
43
-
44
-
45
-
46
-
47
-
48
-
49
-
50
-
51
-
52
-
53
-
54
-
55
-
56
-
57
-
58
-
59
-
 60
60 -
 61
61 -
 62
62 -
 63
63 -
 64
64 -
 65
65 -
 66
66 -
 67
67 -
 68
68 -
 69
69 -
 70
70 -
 71
71 -
 72
72 -
 73
73 -
 74
74 -
 75
75 -
 76
76 -
 77
77 -
 78
78 -
 79
79 -
 80
80 -
81
-
82
-
83
-
84
-
85
-
86
-
87
-
88
-
89
-
90
-
91
-
92
 |
 |

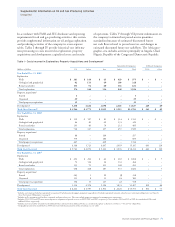
68 Chevron Corporation 2009 Annual Report
FS-PB
Note 24
Other Financial Information
Earnings in 2009 included gains of approximately $1,000
relating to the sale of nonstrategic properties. Of this amount,
approximately $600 and $400 related to downstream and
upstream assets, respectively. Earnings in 2008 included gains of
approximately $1,200 relating to the sale of nonstrategic proper-
ties. Of this amount, approximately $1,000 related to upstream
assets. Earnings in 2007 included gains of approximately $2,000
relating to the sale of nonstrategic properties. Of this amount,
approximately $1,100 related to downstream assets and $680
related to the sale of the company’s investment in Dynegy, Inc.
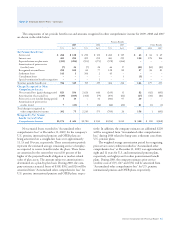
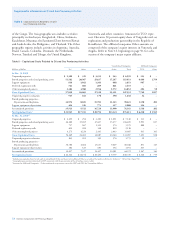
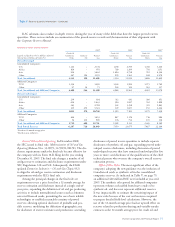
Other financial information is as follows:
Year ended December 31
2009 2008 2007
Total financing interest and debt costs $ 301 $ 256 $ 468
Less: Capitalized interest 273 256 302
Interest and debt expense $ 28 $ – $ 166
Research and development expenses $ 603 $ 702 $ 510
Foreign currency effects* $ (744) $ 862 $ (352)
*
Includes $(194), $420 and $18 in 2009, 2008 and 2007, respectively, for the com-
pany’s share of equity affiliates’ foreign currency effects.
The excess of replacement cost over the carrying value of
inventories for which the Last-In, First-Out (LIFO) method
is used was $5,491 and $9,368 at December 31, 2009 and
2008, respectively. Replacement cost is generally based on
average acquisition costs for the year. LIFO (charges) profits
of $(168), $210 and $113 were included in earnings for the
years 2009, 2008 and 2007, respectively.
The company has $4,618 in goodwill on the Consoli-
dated Balance Sheet related to its 2005 acquisition of Unocal.
Under the accounting standard for goodwill (ASC 350), the
company tested this goodwill for impairment during 2009
and concluded no impairment was necessary.
Events subsequent to December 31, 2009, were evaluated
until the time of the Form 10-K filing with the Securities
and Exchange Commission on February 25, 2010.
Note 25
Assets Held for Sale
At December 31, 2009, the company reported no assets
as “Assets held for sale” (AHS) on the Consolidated Bal-
ance Sheet. At December 31, 2008, $252 of net properties,
plant and equipment were reported as AHS. Assets in this
category are related to groups of service stations, aviation
facilities, lubricants blending plants, and commercial and
industrial fuels business. These assets were sold in 2009.
Note 26
Earnings Per Share
Basic earnings per share (EPS) is based upon Net Income
Attributable to Chevron Corporation (“earnings”) less pre-
ferred stock dividend requirements and includes the effects
of deferrals of salary and other compensation awards that
are invested in Chevron stock units by certain officers and
employees of the company and the company’s share of
stock transactions of affiliates, which, under the applicable
accounting rules, may be recorded directly to the com-
pany’s retained earnings instead of net income. Diluted
EPS includes the effects of these items as well as the dilu-
tive effects of outstanding stock options awarded under the
company’s stock option programs (refer to Note 20, “Stock
Options and Other Share-Based Compensation,” beginning
on page 58). The table below sets forth the computation
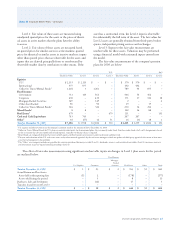
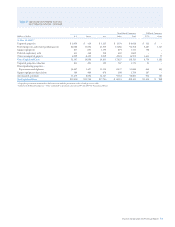
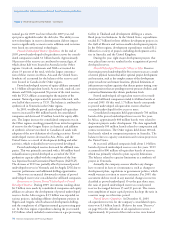
of basic and diluted EPS:
Year ended December 31
2009 2008 2007
Basic EPS Calculation
Earnings available to common stockholders – Basic1 $ 10,483 $ 23,931 $ 18,688
Weighted-average number of common shares outstanding 1,991 2,037 2,117
Add: Deferred awards held as stock units 1 1 1
Total weighted-average number of common shares outstanding 1,992 2,038 2,118
Per share of common stock
Earnings – Basic $ 5.26 $ 11.74 $ 8.83
Diluted EPS Calculation
Earnings available to common stockholders – Diluted1 $ 10,483 $ 23,931 $ 18,688
Weighted-average number of common shares outstanding 1,991 2,037 2,117
Add: Deferred awards held as stock units 1 1 1
Add: Dilutive effect of employee stock-based awards 9 12 14
Total weighted-average number of common shares outstanding 2,001 2,050 2,132
Per share of common stock
Earnings – Diluted $ 5.24 $ 11.67 $ 8.77
1 There was no effect of dividend equivalents paid on stock units or dilutive impact of employee stock-based awards on earnings.
Notes to the Consolidated Financial Statements
Millions of dollars, except per-share amounts