Chevron 2009 Annual Report Download - page 51
Download and view the complete annual report
Please find page 51 of the 2009 Chevron annual report below. You can navigate through the pages in the report by either clicking on the pages listed below, or by using the keyword search tool below to find specific information within the annual report.-
 1
1 -
2
-
3
-
4
-
5
-
6
-
7
-
8
-
9
-
10
-
11
-
12
-
13
-
14
-
15
-
16
-
17
-
18
-
19
-
20
-
21
-
22
-
23
-
24
-
25
-
26
-
27
-
28
-
29
-
30
-
31
-
32
-
33
-
34
-
35
-
36
-
37
-
38
-
39
-
40
-
 41
41 -
 42
42 -
 43
43 -
 44
44 -
 45
45 -
 46
46 -
 47
47 -
 48
48 -
 49
49 -
 50
50 -
 51
51 -
 52
52 -
 53
53 -
 54
54 -
 55
55 -
 56
56 -
 57
57 -
 58
58 -
 59
59 -
 60
60 -
 61
61 -
62
-
63
-
64
-
65
-
66
-
67
-
68
-
69
-
70
-
71
-
72
-
73
-
74
-
75
-
76
-
77
-
78
-
79
-
80
-
81
-
82
-
83
-
84
-
85
-
86
-
87
-
88
-
89
-
90
-
91
-
92
 |
 |

Chevron Corporation 2009 Annual Report 49
FS-PB
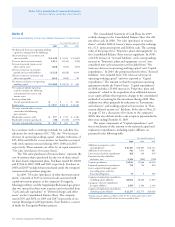
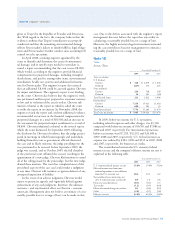
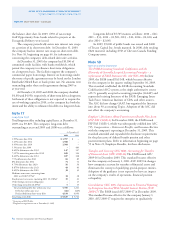
Segment Income Taxes Segment income tax expense for the
years 2009, 2008 and 2007 is as follows:
Year ended December 31
2009 2008 2007
Upstream
United States $ 1,225 $ 3,693 $ 2,541
International 7,686 15,132 11,307
Total Upstream 8,911 18,825 13,848
Downstream
United States (111) 815 520
International 182 813 400
Total Downstream 71 1,628 920
Chemicals
United States 54 (22) 6
International 46 47 36
Total Chemicals 100 25 42
All Other (1,117) (1,452) (1,331)
Total Income Tax Expense $ 7,965 $ 19,026 $ 13,479
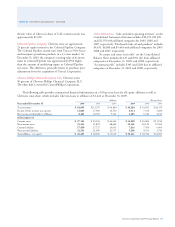
Other Segment Information Additional information for the
segmentation of major equity affiliates is contained in Note
12, beginning on page 50. Information related to proper-
ties, plant and equipment by segment is contained in Note 13,
on page 52.
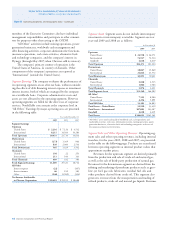
for the chemicals segment are derived primarily from the man-
ufacture and sale of additives for lubricants and fuels. “All
Other” activities include revenues from mining operations,
power generation businesses, insurance operations, real estate
activities and technology companies.
Other than the United States, no single country accounted
for 10 percent or more of the company’s total sales and other
operating revenues in 2009, 2008 and 2007.
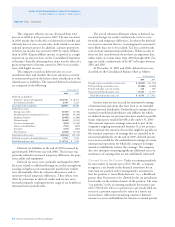
Year ended December 31
2009 2008 2007
Upstream
United States $ 9,164 $ 23,503 $ 18,736
Intersegment 10,278 15,142 11,625
Total United States 19,442 38,645 30,361
International 13,409 19,469 15,213
Intersegment 18,477 24,204 19,647
Total International 31,886 43,673 34,860
Total Upstream 51,328 82,318 65,221
Downstream
United States 57,846 87,515 70,535
Excise and similar taxes 4,573 4,746 4,990
Intersegment 190 447 491
Total United States 62,609 92,708 76,016
International 76,668 122,064 97,178
Excise and similar taxes 3,471 5,044 5,042
Intersegment 106 122 38
Total International 80,245 127,230 102,258
Total Downstream 142,854 219,938 178,274
Chemicals
United States 271 305 351
Excise and similar taxes – 2 2
Intersegment 194 266 235
Total United States 465 573 588
International 1,231 1,388 1,143
Excise and similar taxes 65 55 86
Intersegment 132 154 142
Total International 1,428 1,597 1,371
Total Chemicals 1,893 2,170 1,959
All Other
United States 665 815 757
Intersegment 964 917 760
Total United States 1,629 1,732 1,517
International 39 52 58
Intersegment 33 33 31
Total International 72 85 89
Total All Other 1,701 1,817 1,606
Segment Sales and Other
Operating Revenues
United States 84,145 133,658 108,482
International 113,631 172,585 138,578
Total Segment Sales and Other
Operating Revenues 197,776 306,243 247,060
Elimination of intersegment sales (30,374) (41,285) (32,969)
Total Sales and Other
Operating Revenues $ 167,402 $ 264,958 $ 214,091
Note 11 Operating Segments and Geographic Data – Continued