Chevron 2009 Annual Report Download - page 80
Download and view the complete annual report
Please find page 80 of the 2009 Chevron annual report below. You can navigate through the pages in the report by either clicking on the pages listed below, or by using the keyword search tool below to find specific information within the annual report.-
 1
1 -
2
-
3
-
4
-
5
-
6
-
7
-
8
-
9
-
10
-
11
-
12
-
13
-
14
-
15
-
16
-
17
-
18
-
19
-
20
-
21
-
22
-
23
-
24
-
25
-
26
-
27
-
28
-
29
-
30
-
31
-
32
-
33
-
34
-
35
-
36
-
37
-
38
-
39
-
40
-
41
-
42
-
43
-
44
-
45
-
46
-
47
-
48
-
49
-
50
-
51
-
52
-
53
-
54
-
55
-
56
-
57
-
58
-
59
-
60
-
61
-
62
-
63
-
64
-
65
-
66
-
67
-
68
-
69
-
 70
70 -
 71
71 -
 72
72 -
 73
73 -
 74
74 -
 75
75 -
 76
76 -
 77
77 -
 78
78 -
 79
79 -
 80
80 -
 81
81 -
 82
82 -
 83
83 -
 84
84 -
 85
85 -
 86
86 -
 87
87 -
 88
88 -
 89
89 -
 90
90 -
91
-
92
 |
 |

FS-PB
78 Chevron Corporation 2009 Annual Report
Supplemental Information on Oil and Gas Producing Activities
natural gas for 2009 was lower than the 2009 year-end
spot prices applicable under the old rules. The ability to use
new technologies in reserves determination did not impact
reserves significantly, as most reserve additions and revisions
were based on conventional technologies.
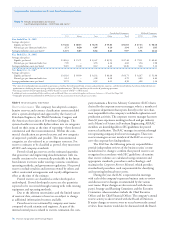
Proved Undeveloped Reserve Quantities At the end of
2009, proved undeveloped oil-equivalent reserves for consoli-
dated companies totaled 3.1 billion barrels. Approximately
58 percent of the reserves are attributed to natural gas, of
which about half were located in Australia in the Other
regions. Crude oil, condensate and NGLs accounted for
about 33 percent of the total, with the largest concentra-
tion of these reserves in Africa, Asia and the United States.
Synthetic oil accounted for the balance of the reserves and
were located in Canada in the Other regions.
Proved undeveloped reserves of equity affiliates amounted
to 1.3 billion oil-equivalent barrels. At year-end, crude oil, con-
densate and NGLs represented 58 percent of the total reserves,
with the TCO affiliate accounting for the majority of the
amount. Natural gas represented 26 percent of the total, with
over half of these reserves at TCO. The balance is attributed to
synthetic oil in Venezuela in the Other regions.
In 2009, worldwide proved undeveloped oil-equivalent
reserves increased by 480 million barrels for consolidated
companies and decreased 19 million barrels for equity affili-
ates. The largest increase for consolidated companies was in
the Other regions, resulting primarily from initial recognition
of reserves for the Gorgon Project in Australia and addition
of synthetic oil reserves related to Canadian oil sands with
adoption of the new definition of oil and gas activity. Proved
undeveloped reserves decreased in Asia, Africa, and the
United States, as a result of development drilling and other
activities, which reclassified reserves to proved developed.
Proved undeveloped reserves decreased for affiliated com-
panies. This was primarily associated with a 146 million barrel
reclassification to proved developed as a result of the TCO
production capacity added with the completion of the Sour
Gas Injection/Second Generation Plant Projects (SGI/SGP).
The decrease at TCO was partially offset by increased proved
undeveloped reserves in Venezuela and for Angola LNG due to
reservoir performance and additional drilling opportunities.
There were no material downward revisions of proved
undeveloped reserves for consolidated or affiliated companies.
Investment to Convert Proved Undeveloped to Proved
Developed Reserves During 2009, investments totaling about
$6.9 billion were made by consolidated companies and equity
affiliates to advance the development of proved undeveloped
reserves. In the Africa region, $2.5 billion was expended on
various projects, including offshore development projects in
Nigeria and Angola, which advanced development drilling,
and the completion of a Nigerian natural gas processing proj-
ect. In the Asia region, expenditures during the year totaled
$1.5 billion, which included construction on a gas processing
facility in Thailand and development drilling at a steam-
flood project in Indonesia. In the United States, expenditures
totaled $1.7 billion for three offshore development projects in
the Gulf of Mexico and various smaller development projects.
In the Other regions, development expenditures totaled $1.2
billion for a variety of projects including development activi-
ties in Australia and the United Kingdom.
During the year, eight major development projects that
were placed into service resulted in the recognition of proved
developed reserves.
Proved Undeveloped Reserves for 5 Years or More Reserves
that remain proved undeveloped for five or more years are a result
of several physical factors that affect optimal project development
and execution, such as the complex nature of the development
project in adverse and remote locations, physical limitations of
infrastructure or plant capacities that dictate project timing, com-
pression projects that are pending reservoir pressure declines, and
contractual limitations that dictate production levels.
Proved undeveloped oil-equivalent reserves for consoli-
dated and affiliated companies totaled 4.4 billion barrels at
year-end 2009. Of this total, 1.7 billion barrels corresponds
to proved undeveloped oil-equivalent reserves that have
remained undeveloped for five years or more.
Consolidated companies held approximately 700 million
barrels of the proved undeveloped reserves over five years.
In Africa, approximately 400 million barrels were related to
deepwater projects under development. The Asia region held
approximately 100 million barrels related to compression and
contract restrictions. The Other regions held about 100 mil-
lion barrels related to compression projects in Australia. The
balance relates to capacity constraints and various projects in
the United States.
At year end, affiliated companies held about 1.0 billion
barrels of proved undeveloped reserves over five years. TCO
accounted for 800 million oil-equivalent barrels of reserves,
which was primarily related to plant capacity limitations.
The balance related to capacity limitations at a synthetic oil
project in Venezuela.
Annually, the company assesses whether any changes
have occurred in facts or circumstances, such as changes to
development plans, regulations or government policies, which
would warrant a revision to reserve estimates. For 2009, this
assessment did not result in any material changes in reserves
classified as proved undeveloped. Over the past three years,
the ratio of proved undeveloped reserves to total proved
reserves has ranged between 35 and 39 percent. The consis-
tent completion of major capital projects has kept the ratio in
a narrow range over this time period.
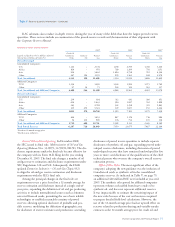
Proved Reserve Quantities At December 31, 2009,
oil-equivalent reserves for the company’s consolidated opera-
tions were 8.3 billion barrels. (Refer to the term “Reserves”
on page 8 for the definition of oil-equivalent reserves.)
Approximately 22 percent of the total reserves were located
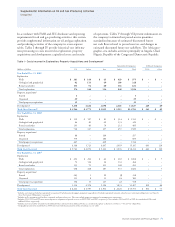
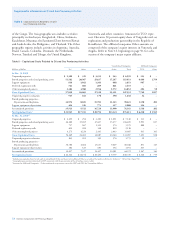
Table V Reserve Quantity Information – Continued