Chevron 2009 Annual Report Download - page 50
Download and view the complete annual report
Please find page 50 of the 2009 Chevron annual report below. You can navigate through the pages in the report by either clicking on the pages listed below, or by using the keyword search tool below to find specific information within the annual report.-
 1
1 -
2
-
3
-
4
-
5
-
6
-
7
-
8
-
9
-
10
-
11
-
12
-
13
-
14
-
15
-
16
-
17
-
18
-
19
-
20
-
21
-
22
-
23
-
24
-
25
-
26
-
27
-
28
-
29
-
30
-
31
-
32
-
33
-
34
-
35
-
36
-
37
-
38
-
39
-
 40
40 -
 41
41 -
 42
42 -
 43
43 -
 44
44 -
 45
45 -
 46
46 -
 47
47 -
 48
48 -
 49
49 -
 50
50 -
 51
51 -
 52
52 -
 53
53 -
 54
54 -
 55
55 -
 56
56 -
 57
57 -
 58
58 -
 59
59 -
 60
60 -
61
-
62
-
63
-
64
-
65
-
66
-
67
-
68
-
69
-
70
-
71
-
72
-
73
-
74
-
75
-
76
-
77
-
78
-
79
-
80
-
81
-
82
-
83
-
84
-
85
-
86
-
87
-
88
-
89
-
90
-
91
-
92
 |
 |

48 Chevron Corporation 2009 Annual Report
FS-PB
members of the Executive Committee also have individual
management responsibilities and participate in other commit-
tees for purposes other than acting as the CODM.
“All Other” activities include mining operations, power
generation businesses, worldwide cash management and
debt financing activities, corporate administrative functions,
insurance operations, real estate activities, alternative fuels
and technology companies, and the company’s interest in
Dynegy (through May 2007, when Chevron sold its interest).
The company’s primary country of operation is the
United States of America, its country of domicile. Other
components of the company’s operations are reported as
“International” (outside the United States).
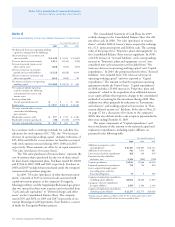
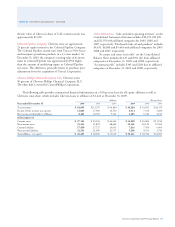
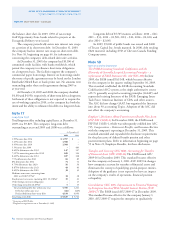
Segment Earnings The company evaluates the performance of
its operating segments on an after-tax basis, without consider-
ing the effects of debt financing interest expense or investment
interest income, both of which are managed by the company
on a worldwide basis. Corporate administrative costs and
assets are not allocated to the operating segments. However,
operating segments are billed for the direct use of corporate
services. Nonbillable costs remain at the corporate level in
“All Other.” Earnings by major operating area are presented
in the following table:
Year ended December 31
2009 2008 2007
Segment Earnings
Upstream
United States $ 2,216 $ 7,126 $ 4,532
International 8,215 14,584 10,284
Total Upstream 10,431 21,710 14,816
Downstream
United States (273) 1,369 966
International 838 2,060 2,536
Total Downstream 565 3,429 3,502
Chemicals
United States 198 22 253
International 211 160 143
Total Chemicals 409 182 396
Total Segment Earnings 11,405 25,321 18,714
All Other
Interest expense (22) – (107)
Interest income 46 192 385
Other (946) (1,582) (304)
Net Income Attributable
to Chevron Corporation $ 10,483 $ 23,931 $ 18,688
Note 11 Operating Segments and Geographic Data – Continued
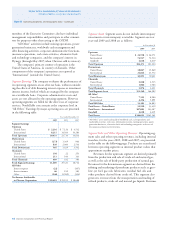
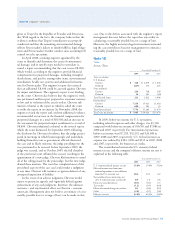
Segment Assets Segment assets do not include intercompany
investments or intercompany receivables. Segment assets at
year-end 2009 and 2008 are as follows:
At December 31
2009 2008
Upstream
United States $ 24,918 $ 26,071
International 74,937 72,530
Goodwill 4,618 4,619
Total Upstream 104,473 103,220
Downstream
United States 18,067 15,869
International 24,824 23,572
Total Downstream 42,891 39,441
Chemicals
United States 2,810 2,535
International 1,066 1,086
Total Chemicals 3,876 3,621
Total Segment Assets 151,240 146,282
All Other*
United States 7,125 8,984
International 6,256 5,899
Total All Other 13,381 14,883
Total Assets – United States 52,920 53,459
Total Assets – International 107,083 103,087
Goodwill 4,618 4,619
Tota l Assets $ 164,621 $ 161,165
* “All Other” assets consist primarily of worldwide cash, cash equivalents and
marketable securities, real estate, information systems, mining operations, power
generation businesses, alternative fuels and technology companies, and assets of
the corporate administrative functions.
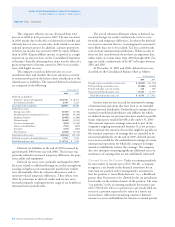
Segment Sales and Other Operating Revenues Operating seg-
ment sales and other operating revenues, including internal
transfers, for the years 2009, 2008 and 2007, are presented
in the table on the following page. Products are transferred
between operating segments at internal product values that
approximate market prices.
Revenues for the upstream segment are derived primarily
from the production and sale of crude oil and natural gas,
as well as the sale of third-party production of natural gas.
Revenues for the downstream segment are derived from the
refining and marketing of petroleum products such as gaso-
line, jet fuel, gas oils, lubricants, residual fuel oils and
other products derived from crude oil. This segment also
generates revenues from the transportation and trading of
refined products, crude oil and natural gas liquids. Revenues
Notes to the Consolidated Financial Statements
Millions of dollars, except per-share amounts