Chevron 2009 Annual Report Download - page 29
Download and view the complete annual report
Please find page 29 of the 2009 Chevron annual report below. You can navigate through the pages in the report by either clicking on the pages listed below, or by using the keyword search tool below to find specific information within the annual report.-
 1
1 -
2
-
3
-
4
-
5
-
6
-
7
-
8
-
9
-
10
-
11
-
12
-
13
-
14
-
15
-
16
-
17
-
18
-
 19
19 -
 20
20 -
 21
21 -
 22
22 -
 23
23 -
 24
24 -
 25
25 -
 26
26 -
 27
27 -
 28
28 -
 29
29 -
 30
30 -
 31
31 -
 32
32 -
 33
33 -
 34
34 -
 35
35 -
 36
36 -
 37
37 -
 38
38 -
 39
39 -
40
-
41
-
42
-
43
-
44
-
45
-
46
-
47
-
48
-
49
-
50
-
51
-
52
-
53
-
54
-
55
-
56
-
57
-
58
-
59
-
60
-
61
-
62
-
63
-
64
-
65
-
66
-
67
-
68
-
69
-
70
-
71
-
72
-
73
-
74
-
75
-
76
-
77
-
78
-
79
-
80
-
81
-
82
-
83
-
84
-
85
-
86
-
87
-
88
-
89
-
90
-
91
-
92
 |
 |
Chevron Corporation 2009 Annual Report 27
FS-PB
12-month period. Refer to Table V, “Reserve Quantity Infor-
mation,” beginning on page 76, for the changes in these
estimates for the three years ending December 31, 2009,
and to Table VII, “Changes in the Standardized Measure of
Discounted Future Net Cash Flows From Proved Reserves”
on page 84 for estimates of proved-reserve values for
each of the three years ended December 31, 2009. Note 1
to the Consolidated Financial Statements, beginning on
page 39, includes a description of the “successful efforts”
method of accounting for oil and gas exploration and pro-
duction activities. The estimates of crude-oil and natural-gas
reserves are important to the timing of expense recognition
for costs incurred.
The discussion of the critical accounting policy for
“Impairment of Properties, Plant and Equipment and Invest-
ments in Affiliates,” beginning on page 28, includes
reference to conditions under which downward revisions of
proved-reserve quantities could result in impairments of oil
and gas properties. This commentary should be read in con-
junction with disclosures elsewhere in this discussion and in
the Notes to the Consolidated Financial Statements related
to estimates, uncertainties, contingencies and new account-
ing standards. Significant accounting policies are discussed in
Note 1 to the Consolidated Financial Statements, beginning
on page 39. The development and selection of accounting
estimates and assumptions, including those deemed “critical,”
and the associated disclosures in this discussion have been
discussed by management with the Audit Committee of the
Board of Directors.
The areas of accounting and the associated “critical” esti-
mates and assumptions made by the company are as follows:
Pension and Other Postretirement Benefit Plans The
determination of pension-plan obligations and expense is
based on a number of actuarial assumptions. Two critical
assumptions are the expected long-term rate of return on
plan assets and the discount rate applied to pension plan
obligations. For other postretirement benefit (OPEB) plans,
which provide for certain health care and life insurance
benefits for qualifying retired employees and which are not
funded, critical assumptions in determining OPEB obliga-
tions and expense are the discount rate and the assumed
health care cost-trend rates.
Note 21, beginning on page 59, includes information on
the funded status of the company’s pension and OPEB
plans at the end of 2009 and 2008; the components of pen-
sion and OPEB expense for the three years ending December
31, 2009; and the underlying assumptions for those periods.
Pension and OPEB expense is reported on the Con-
solidated Statement of Income as “Operating expenses” or
“Selling, general and administrative expenses” and applies to
all business segments. The year-end 2009 and 2008 funded
status, measured as the difference between plan assets and
obligations, of each of the company’s pension and OPEB
plans is recognized on the Consolidated Balance Sheet. The
differences related to overfunded pension plans are reported
as a long-term asset in “Deferred charges and other assets.”
The differences associated with underfunded or unfunded
pension and OPEB plans are reported as “Accrued liabilities”
or “Reserves for employee benefit plans.” Amounts yet to be
recognized as components of pension or OPEB expense are
reported in “Accumulated other comprehensive loss.”
To estimate the long-term rate of return on pension
assets, the company uses a process that incorporates actual
historical asset-class returns and an assessment of expected
future performance and takes into consideration external
actuarial advice and asset-class factors. Asset allocations are
periodically updated using pension plan asset/liability stud-
ies, and the determination of the company’s estimates of
long-term rates of return are consistent with these studies.
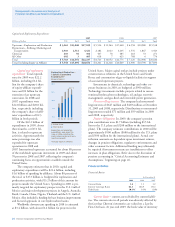
The expected long-term rate of return on U.S. pension plan
assets, which account for 69 percent of the company’s pen-
sion plan assets, has remained at 7.8 percent since 2002. For
the 10 years ending December 31, 2009, actual asset returns
averaged 3.7 percent for this plan. The actual return for 2009
was 15.7 percent and was associated with the broad recovery
in the financial markets.
The year-end market-related value of assets of the major
U.S. pension plan used in the determination of pension
expense was based on the market value in the preceding three
months, as opposed to the maximum allowable period of five
years under U.S. accounting rules. Management considers
the three-month period long enough to minimize the effects
of distortions from day-to-day market volatility and still be
contemporaneous to the end of the year. For other plans,
market value of assets as of year-end is used in calculating
the pension expense.
The discount rate assumptions used to determine U.S.
and international pension and postretirement benefit plan
obligations and expense reflect the prevailing rates available on
high-quality fixed-income debt instruments. At December 31,
2009, the company selected a 5.3 percent discount rate for the
major U.S. pension plan and 5.8 percent for its OPEB plan.
These rates were selected based on a cash flow analysis that
matched estimated future benefit payments to the Citigroup
Pension Discount Yield Curve as of year-end 2009. The dis-
count rates at the end of 2008 and 2007 were 6.3 percent for
both years for the U.S. pension and OPEB plans.
An increase in the expected long-term return on plan
assets or the discount rate would reduce pension plan
expense, and vice versa. Total pension expense for 2009 was
$1.1 billion. As an indication of the sensitivity of pension
expense to the long-term rate of return assumption, a 1 per-
cent increase in the expected rate of return on assets of the
company’s primary U.S. pension plan would have reduced
total pension plan expense for 2009 by approximately
$50 million. A 1 percent increase in the discount rate for
this same plan, which accounted for about 61 percent of the