Chevron 2009 Annual Report Download - page 73
Download and view the complete annual report
Please find page 73 of the 2009 Chevron annual report below. You can navigate through the pages in the report by either clicking on the pages listed below, or by using the keyword search tool below to find specific information within the annual report.-
 1
1 -
2
-
3
-
4
-
5
-
6
-
7
-
8
-
9
-
10
-
11
-
12
-
13
-
14
-
15
-
16
-
17
-
18
-
19
-
20
-
21
-
22
-
23
-
24
-
25
-
26
-
27
-
28
-
29
-
30
-
31
-
32
-
33
-
34
-
35
-
36
-
37
-
38
-
39
-
40
-
41
-
42
-
43
-
44
-
45
-
46
-
47
-
48
-
49
-
50
-
51
-
52
-
53
-
54
-
55
-
56
-
57
-
58
-
59
-
60
-
61
-
62
-
 63
63 -
 64
64 -
 65
65 -
 66
66 -
 67
67 -
 68
68 -
 69
69 -
 70
70 -
 71
71 -
 72
72 -
 73
73 -
 74
74 -
 75
75 -
 76
76 -
 77
77 -
 78
78 -
 79
79 -
 80
80 -
 81
81 -
 82
82 -
 83
83 -
84
-
85
-
86
-
87
-
88
-
89
-
90
-
91
-
92
 |
 |

Chevron Corporation 2009 Annual Report 71
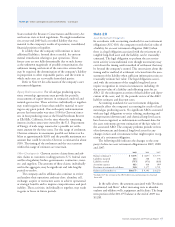
In accordance with FASB and SEC disclosure and reporting
requirements for oil and gas producing activities, this section
provides supplemental information on oil and gas exploration
and producing activities of the company in seven separate
tables. Tables I through IV provide historical cost informa-
tion pertaining to costs incurred in exploration, property
acquisitions and development; capitalized costs; and results
of operations. Tables V through VII present information on
the company’s estimated net proved-reserve quantities,
standardized measure of estimated discounted future
net cash flows related to proved reserves, and changes in
estimated discounted future net cash flows. The Africa geo-
graphic area includes activities principally in Angola, Chad,
Nigeria, Republic of the Congo and Democratic Republic
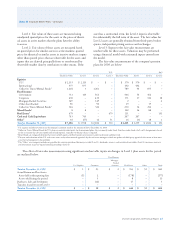
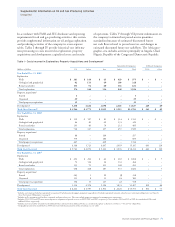
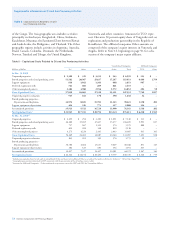
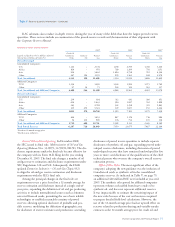
Table I – Costs Incurred in Exploration, Property Acquisitions and Development1
Consolidated Companies Affiliated Companies
Millions of dollars U.S. Africa Asia Other Total TCO Other
Year Ended Dec. 31, 2009
Exploration
Wells $ 361 $ 140 $ 45 $ 429 $ 975 $ – $ –
Geological and geophysical 62 114 49 103 328 – –
Rentals and other 153 92 60 316 621 – –
Total exploration 576 346 154 848 1,924 – –
Property acquisitions2
Proved 3 – – – 3 – –
Unproved 29 – – – 29 – –
Total property acquisitions 32 – – – 32 – –
Development3 3,338 3,426 2,698 2,365 11,827 265 69
Total Costs Incurred4 $ 3,946 $ 3,772 $ 2,852 $ 3,213 $ 13,783 $ 265 $ 69
Year Ended Dec. 31, 20085
Exploration
Wells $ 519 $ 197 $ 85 $ 314 $ 1,115 $– $ –
Geological and geophysical 66 90 42 131 329 – –
Rentals and other 143 60 70 212 485 – –
Total exploration 728 347 197 657 1,929 – –
Property acquisitions2
Proved 88 – 169 – 257 – –
Unproved 579 – 280 – 859 – –
Total property acquisitions 667 – 449 – 1,116 – –
Development3 4,348 3,723 4,697 2,419 15,187 643 120
Total Costs Incurred $ 5,743 $ 4,070 $ 5,343 $ 3,076 $ 18,232 $ 643 $ 120
Year Ended Dec. 31, 20075
Exploration
Wells $ 452 $ 202 $ 62 $ 292 $ 1,008 $– $ 7
Geological and geophysical 73 136 24 133 366 – –
Rentals and other 133 70 101 148 452 – –
Total exploration 658 408 187 573 1,826 – 7
Property acquisitions2
Proved 243 5 92 (2) 338 – –
Unproved 113 8 35 24 180 – –
Total property acquisitions 356 13 127 22 518 – –
Development3 5,210 4,176 2,190 1,831 13,407 832 64
Total Costs Incurred $ 6,224 $ 4,597 $ 2,504 $ 2,426 $ 15,751 $ 832 $ 71
1 Includes costs incurred whether capitalized or expensed. Excludes general support equipment expenditures. Includes capitalized amounts related to asset retirement obligations. See Note 23,
“Asset Retirement Obligations,” on page 67.
2 Includes wells, equipment and facilities associated with proved reserves. Does not include properties acquired in nonmonetary transactions.
3 Includes $121, $224 and $99 costs incurred prior to assignment of proved reserves in 2009, 2008 and 2007, respectively. Also includes $104 and $12 in 2009 for consolidated Other and
affiliated Other, respectively.
4 Includes cost incurred for oil sands in consolidated Other and heavy oil in affiliated Other as a result of the update to Extractive Industries — Oil and Gas (Topic 932).
5 Geographic presentation conformed to 2009 consistent with the presentation of the oil and gas reserve tables.
Supplemental Information on Oil and Gas Producing Activities
Unaudited