Chevron 2009 Annual Report Download - page 76
Download and view the complete annual report
Please find page 76 of the 2009 Chevron annual report below. You can navigate through the pages in the report by either clicking on the pages listed below, or by using the keyword search tool below to find specific information within the annual report.-
 1
1 -
2
-
3
-
4
-
5
-
6
-
7
-
8
-
9
-
10
-
11
-
12
-
13
-
14
-
15
-
16
-
17
-
18
-
19
-
20
-
21
-
22
-
23
-
24
-
25
-
26
-
27
-
28
-
29
-
30
-
31
-
32
-
33
-
34
-
35
-
36
-
37
-
38
-
39
-
40
-
41
-
42
-
43
-
44
-
45
-
46
-
47
-
48
-
49
-
50
-
51
-
52
-
53
-
54
-
55
-
56
-
57
-
58
-
59
-
60
-
61
-
62
-
63
-
64
-
65
-
 66
66 -
 67
67 -
 68
68 -
 69
69 -
 70
70 -
 71
71 -
 72
72 -
 73
73 -
 74
74 -
 75
75 -
 76
76 -
 77
77 -
 78
78 -
 79
79 -
 80
80 -
 81
81 -
 82
82 -
 83
83 -
 84
84 -
 85
85 -
 86
86 -
87
-
88
-
89
-
90
-
91
-
92
 |
 |

FS-PB
74 Chevron Corporation 2009 Annual Report
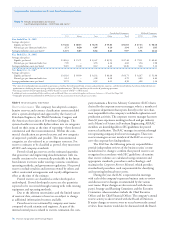
Supplemental Information on Oil and Gas Producing Activities
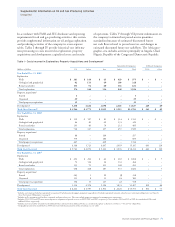
Table III Results of Operations for Oil and
Gas Producing Activities1
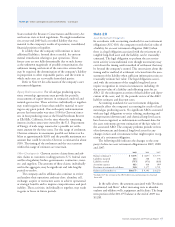
The company’s results of operations from oil and gas
producing activities for the years 2009, 2008 and 2007 are
shown in the following table. Net income from exploration
and production activities as reported on page 48 reflects
income taxes computed on an effective rate basis.
Income taxes in Table III are based on statutory tax rates,
reflecting allowable deductions and tax credits. Interest
income and expense are excluded from the results reported in
Table III and from the net income amounts on page 48.
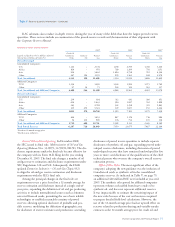
Consolidated Companies Affiliated Companies
Millions of dollars U.S. Africa Asia Other Tot a l TCO Other
Year Ended Dec. 31, 20092
Revenues from net production
Sales $ 2,278 $ 1,767 $ 5,648 $ 3,173 $ 12,866 $ 4,043 $ 938
Transfers 9,133 7,304 4,926 3,866 25,229 – –
Tota l 11,411 9,071 10,574 7,039 38,095 4,043 938
Production expenses excluding taxes (3,281) (1,345) (2,208) (1,390) (8,224) (363) (240)
Taxes other than on income (367) (132) (53) (284) (836) (50) (96)
Proved producing properties:
Depreciation and depletion (3,493) (2,175) (2,279) (1,598) (9,545) (381) (88)
Accretion expense3 (194) (66) (70) (79) (409) (7) (3)
Exploration expenses (451) (236) (113) (542) (1,342) – –
Unproved properties valuation (228) (11) (44) (28) (311) – –
Other income (expense)4 156 98 (327) (340) (413) (131) 9
Results before income taxes 3,553 5,204 5,480 2,778 17,015 3,111 520
Income tax expense (1,258) (3,214) (2,921) (1,360) (8,753) (935) (258)
Results of Producing Operations $ 2,295 $ 1,990 $ 2,559 $ 1,418 $ 8,262 $ 2,176 $ 262
Year Ended Dec. 31, 20085
Revenues from net production
Sales $ 4,882 $ 2,578 $ 7,969 $ 4,534 $ 19,963 $ 4,971 $ 1,599
Transfers 12,868 8,373 7,179 5,150 33,570 – –
Tota l 17,750 10,951 15,148 9,684 53,533 4,971 1,599
Production expenses excluding taxes (3,822) (1,228) (2,096) (969) (8,115) (376) (125)
Taxes other than on income (716) (163) (263) (370) (1,512) (41) (278)
Proved producing properties:
Depreciation and depletion (2,286) (1,176) (2,299) (1,452) (7,213) (237) (77)
Accretion expense3 (242) (60) (48) (59) (409) (2) (1)
Exploration expenses (370) (223) (178) (398) (1,169) – –
Unproved properties valuation (114) (13) (36) (8) (171) – –
Other income (expense)4 707 (350) 198 318 873 184 105
Results before income taxes 10,907 7,738 10,426 6,746 35,817 4,499 1,223
Income tax expense (3,856) (6,051) (5,697) (3,441) (19,045) (1,357) (612)
Results of Producing Operations $ 7,051 $ 1,687 $ 4,729 $ 3,305 $ 16,772 $ 3,142 $ 611
1 The value of owned production consumed in operations as fuel has been eliminated from revenues and production expenses, and the related volumes have been deducted from net
production in calculating the unit average sales price and production cost. This has no effect on the results of producing operations.
2 Includes results of producing operations for oil sands in consolidated Other and heavy oil in affiliated Other as a result of the update to Extractive Industries — Oil and Gas (Topic 932).
3 Represents accretion of ARO liability. Refer to Note 23, “Asset Retirement Obligations,” on page 67.
4 Includes foreign currency gains and losses, gains and losses on property dispositions, and income from operating and technical service agreements.
5 Geographic presentation conformed to 2009 consistent with the presentation of the oil and gas reserve tables.