Chevron 2009 Annual Report Download - page 33
Download and view the complete annual report
Please find page 33 of the 2009 Chevron annual report below. You can navigate through the pages in the report by either clicking on the pages listed below, or by using the keyword search tool below to find specific information within the annual report.-
 1
1 -
2
-
3
-
4
-
5
-
6
-
7
-
8
-
9
-
10
-
11
-
12
-
13
-
14
-
15
-
16
-
17
-
18
-
19
-
20
-
21
-
22
-
 23
23 -
 24
24 -
 25
25 -
 26
26 -
 27
27 -
 28
28 -
 29
29 -
 30
30 -
 31
31 -
 32
32 -
 33
33 -
 34
34 -
 35
35 -
 36
36 -
 37
37 -
 38
38 -
 39
39 -
 40
40 -
 41
41 -
 42
42 -
 43
43 -
44
-
45
-
46
-
47
-
48
-
49
-
50
-
51
-
52
-
53
-
54
-
55
-
56
-
57
-
58
-
59
-
60
-
61
-
62
-
63
-
64
-
65
-
66
-
67
-
68
-
69
-
70
-
71
-
72
-
73
-
74
-
75
-
76
-
77
-
78
-
79
-
80
-
81
-
82
-
83
-
84
-
85
-
86
-
87
-
88
-
89
-
90
-
91
-
92
 |
 |

Chevron Corporation 2009 Annual Report 31
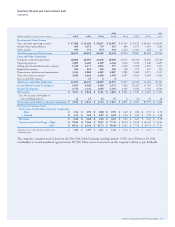
Quarterly Results and Stock Market Data
Unaudited
2009 2008
Millions of dollars, except per-share amounts 4th Q 3rd Q 2nd Q 1st Q 4th Q 3rd Q 2nd Q 1st Q
Revenues and Other Income
Sales and other operating revenues1 $ 47,588 $ 45,180 $ 39,647 $ 34,987 $ 43,145 $ 76,192 $ 80,962 $ 64,659
Income from equity affiliates 898 1,072 735 611 886 1,673 1,563 1,244
Other income 190 373 (177) 532 1,172 1,002 464 43
Total Revenues and Other Income 48,676 46,625 40,205 36,130 45,203 78,867 82,989 65,946
Costs and Other Deductions
Purchased crude oil and products 28,606 26,969 23,678 20,400 23,575 49,238 56,056 42,528
Operating expenses 4,899 4,403 4,209 4,346 5,416 5,676 5,248 4,455
Selling, general and administrative expenses 1,330 1,177 1,043 977 1,492 1,278 1,639 1,347
Exploration expenses 281 242 438 381 338 271 307 253
Depreciation, depletion and amortization 3,156 2,988 3,099 2,867 2,589 2,449 2,275 2,215
Taxes other than on income1 4,583 4,644 4,386 3,978 4,547 5,614 5,699 5,443
Interest and debt expense – 14 6 8 – – – –
Total Costs and Other Deductions 42,855 40,437 36,859 32,957 37,957 64,526 71,224 56,241
Income Before Income Tax Expense 5,821 6,188 3,346 3,173 7,246 14,341 11,765 9,705
Income Tax Expense 2,719 2,342 1,585 1,319 2,345 6,416 5,756 4,509
Net Income $ 3,102 $ 3,846 $ 1,761 $ 1,854 $ 4,901 $ 7,925 $ 6,009 $ 5,196
Less: Net income attributable to
noncontrolling interests 32 15 16 17 6 32 34 28
Net Income Attributable to Chevron Corporation $ 3,070 $ 3,831 $ 1,745 $ 1,837 $ 4,895 $ 7,893 $5,975 $ 5,168
Per-Share of Common Stock
Net Income Attributable to Chevron Corporation
– Basic $ 1.54 $ 1.92 $ 0.88 $ 0.92 $ 2.45 $ 3.88 $ 2.91 $ 2.50
– Diluted $ 1.53 $ 1.92 $ 0.87 $ 0.92 $ 2.44 $ 3.85 $ 2.90 $ 2.48
Dividends $ 0.68 $ 0.68 $ 0.65 $ 0.65 $ 0.65 $ 0.65 $ 0.65 $ 0.58
Common Stock Price Range – High2 $ 79.64 $ 72.64 $ 72.67 $ 77.35 $ 82.20 $ 99.08 $ 103.09 $ 94.61
– Low2 $ 68.14 $ 61.40 $ 63.75 $ 56.46 $ 57.83 $ 77.50 $ 86.74 $ 77.51
1 Includes excise, value-added and similar taxes: $ 2,086 $ 2,079 $ 2,034 $ 1,910 $ 2,080 $ 2,577 $ 2,652 $ 2,537
2 End of day price.
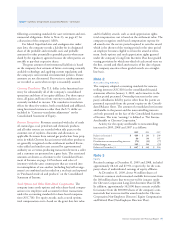
The company’s common stock is listed on the New York Stock Exchange (trading symbol: CVX). As of February 19, 2010,
stockholders of record numbered approximately 195,000. There are no restrictions on the company’s ability to pay dividends.