Chevron 2009 Annual Report Download - page 22
Download and view the complete annual report
Please find page 22 of the 2009 Chevron annual report below. You can navigate through the pages in the report by either clicking on the pages listed below, or by using the keyword search tool below to find specific information within the annual report.-
 1
1 -
2
-
3
-
4
-
5
-
6
-
7
-
8
-
9
-
10
-
11
-
 12
12 -
 13
13 -
 14
14 -
 15
15 -
 16
16 -
 17
17 -
 18
18 -
 19
19 -
 20
20 -
 21
21 -
 22
22 -
 23
23 -
 24
24 -
 25
25 -
 26
26 -
 27
27 -
 28
28 -
 29
29 -
 30
30 -
 31
31 -
 32
32 -
33
-
34
-
35
-
36
-
37
-
38
-
39
-
40
-
41
-
42
-
43
-
44
-
45
-
46
-
47
-
48
-
49
-
50
-
51
-
52
-
53
-
54
-
55
-
56
-
57
-
58
-
59
-
60
-
61
-
62
-
63
-
64
-
65
-
66
-
67
-
68
-
69
-
70
-
71
-
72
-
73
-
74
-
75
-
76
-
77
-
78
-
79
-
80
-
81
-
82
-
83
-
84
-
85
-
86
-
87
-
88
-
89
-
90
-
91
-
92
 |
 |

Management’s Discussion and Analysis of
Financial Condition and Results of Operations
20 Chevron Corporation 2009 Annual Report
FS-PB
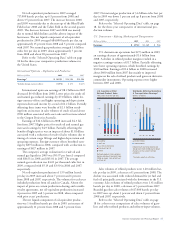
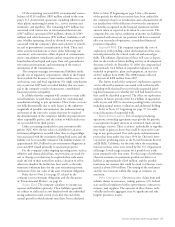
Capital and exploratory
expenditures Tot a l expendi-
tures for 2009 were $22.2
billion, including $1.6 bil-
lion for the company’s share
of equity-affiliate expendi-
tures and $2 billion for the
extension of an upstream
concession. In 2008 and
2007, expenditures were
$22.8 billion and $20.0 bil-
lion, respectively, including
the company’s share of affil-
iates’ expenditures of $2.3
billion in both periods.
Of the $22.2 billion of
expenditures in 2009, about
three-fourths, or $17.1 bil-
lion, is related to upstream
activities. Approximately the
same percentage was also
expended for upstream
operations in 2008 and
2007. International upstream accounted for about 80 percent
of the worldwide upstream investment in 2009 and about
70 percent in 2008 and 2007, reflecting the company’s
continuing focus on opportunities available outside the
United States.
The company estimates that in 2010, capital and
exploratory expenditures will be $21.6 billion, including
$1.6 billion of spending by affiliates. About 80 percent of
the total, or $17.3 billion, is budgeted for exploration and
production activities, with $13.2 billion of this amount for
projects outside the United States. Spending in 2010 is pri-
marily targeted for exploratory prospects in the U.S. Gulf of
Mexico and major development projects in Angola, Australia,
Brazil, Canada, China, Nigeria, Thailand and the U.S. Gulf of
Mexico. Also included is funding for base business improvements
and focused appraisals in core hydrocarbon basins.
Worldwide downstream spending in 2010 is estimated
at $3.4 billion, with about $1.6 billion for projects in the
United States. Major capital outlays include projects under
construction at refineries in the United States and South
Korea and construction of gas-to-liquids facilities in support
of associated upstream projects.
Investments in chemicals, technology and other cor-
porate businesses in 2010 are budgeted at $900 million.
Technology investments include projects related to uncon-
ventional hydrocarbon technologies, oil and gas reservoir
management, and gas-fired and renewable power generation.
Noncontrolling interests The company had noncontrol-
ling interests of $647 million and $469 million at December
31, 2009 and 2008, respectively. Distributions to noncontrol-
ling interests totaled $71 million and $99 million in 2009
and 2008, respectively.
Pension Obligations In 2009, the company’s pension
plan contributions were $1.7 billion (including $1.5 bil-
lion to the U.S. plans and $200 million to the international
plans). The company estimates contributions in 2010 will be
approximately $900 million ($600 million for the U.S. plans
and $300 million for the international plans). Actual con-
tribution amounts are dependent upon investment returns,
changes in pension obligations, regulatory environments and
other economic factors. Additional funding may ultimately
be required if investment returns are insufficient to offset
increases in plan obligations. Refer also to the discussion of
pension accounting in “Critical Accounting Estimates and
Assumptions,” beginning on page 26.
Financial Ratios
Financial Ratios
At December 31
2009 2008 2007
Current Ratio 1.4 1.1 1.2
Interest Coverage Ratio 62.3 166.9 69.2
Debt Ratio 10.3% 9.3% 8.6%
Current Ratio – current assets divided by current liabili-
ties. The current ratio in all periods was adversely affected by
the fact that Chevron’s inventories are valued on a Last-In,
First-Out basis. At year-end 2009, the book value of inventory
Capital and Exploratory Expenditures
2009 2008 2007
Millions of dollars U.S. Int’l. Total U.S. Int’l. Total U.S. I nt’ l. Tot al
Upstream – Exploration and Production $ 3,261 $ 13,848 $ 17,109 $ 5,516 $ 11,944 $ 17,460 $ 4,558 $ 10,980 $ 15,538
Downstream – Refining, Marketing and
Transportation 1,910 2,511 4,421 2,182 2,023 4,205 1,576 1,867 3,443
Chemicals 210 92 302 407 78 485 218 53 271
All Other 402 3 405 618 7 625 768 6 774
Total $ 5,783 $ 16,454 $ 22,237 $ 8,723 $ 14,052 $ 22,775 $ 7,120 $ 12,906 $ 20,026
Total, Excluding Equity in Affiliates $ 5,558 $ 15,094 $ 20,652 $ 8,241 $ 12,228 $ 20,469 $ 6,900 $ 10,790 $ 17,690
0.0
20.0
10.0
15.0
5.0
#015 – Exp & Prod – Cap & Exploratory
Expend – v3
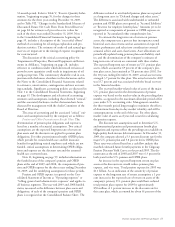
Exploration & Production —
Capital & Exploratory
Expenditures*
Billions of dollars
United States
International
Exploration and production
expenditures were about the
same as 2008, reflecting the
capital-intensive phase of many
significant projects.
* Includes equity in affiliates
0605 07 08 09
$17.1