Chevron 2009 Annual Report Download - page 13
Download and view the complete annual report
Please find page 13 of the 2009 Chevron annual report below. You can navigate through the pages in the report by either clicking on the pages listed below, or by using the keyword search tool below to find specific information within the annual report.-
 1
1 -
2
-
 3
3 -
 4
4 -
 5
5 -
 6
6 -
 7
7 -
 8
8 -
 9
9 -
 10
10 -
 11
11 -
 12
12 -
 13
13 -
 14
14 -
 15
15 -
 16
16 -
 17
17 -
 18
18 -
 19
19 -
 20
20 -
 21
21 -
 22
22 -
 23
23 -
24
-
25
-
26
-
27
-
28
-
29
-
30
-
31
-
32
-
33
-
34
-
35
-
36
-
37
-
38
-
39
-
40
-
41
-
42
-
43
-
44
-
45
-
46
-
47
-
48
-
49
-
50
-
51
-
52
-
53
-
54
-
55
-
56
-
57
-
58
-
59
-
60
-
61
-
62
-
63
-
64
-
65
-
66
-
67
-
68
-
69
-
70
-
71
-
72
-
73
-
74
-
75
-
76
-
77
-
78
-
79
-
80
-
81
-
82
-
83
-
84
-
85
-
86
-
87
-
88
-
89
-
90
-
91
-
92
 |
 |

Chevron Corporation 2009 Annual Report 11
FS-PB
contracting, procurement and supply-chain activities to effec-
tively manage costs. (Refer to the “Upstream” section below
for a discussion of the trend in crude-oil prices.)
The company continues to closely monitor developments
in the financial and credit markets, the level of worldwide
economic activity and the implications to the company of
movements in prices for crude oil and natural gas. Man-
agement is taking these developments into account in the
conduct of daily operations and for business planning.
The company remains confident of its underlying finan-
cial strength to address potential challenges presented in
this environment. (Refer also to the “Liquidity and Capital
Resources” section beginning on page 19.)
Comments related to earnings trends for the company’s
major business areas are as follows:
Upstream Earnings for the upstream segment are closely
aligned with industry price levels for crude oil and natural
gas. Crude-oil and natural-gas prices are subject to external
factors over which the company has no control, including
product demand connected with global economic conditions,
industry inventory levels, production quotas imposed by the
Organization of Petroleum Exporting Countries (OPEC),
weather-related damage and disruptions, competing fuel
prices, and regional supply interruptions or fears thereof that
may be caused by military conflicts, civil unrest or political
uncertainty. Moreover, any of these factors could also inhibit
the company’s production capacity in an affected region.
The company monitors developments closely in the countries
in which it operates and holds investments, and attempts to
manage risks in operating its facilities and businesses. Besides
the impact of the fluctuation in prices for crude oil and natu-
ral gas, the longer-term trend in earnings for the upstream
segment is also a function of other factors, including the
company’s ability to find or acquire and efficiently produce
crude oil and natural gas, changes in fiscal terms of contracts
and changes in tax laws and regulations.
Price levels for capital and exploratory costs and operat-
ing expenses associated with the production of crude oil and
natural gas can also be subject to external factors beyond
the company’s control. External factors include not only
the general level of inflation but also commodity prices and
prices charged by the industry’s material and service provid-
ers, which can be affected by the volatility of the industry’s
own supply-and-demand conditions for such materials and
services. Capital and exploratory expenditures and operating
expenses also can be affected by damage to production facili-
ties caused by severe weather or civil unrest.
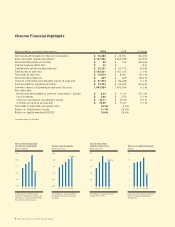
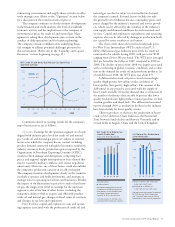
The chart at left shows the trend in benchmark prices
for West Texas Intermediate (WTI) crude oil and U.S.
Henry Hub natural gas. Industry price levels for crude oil
continued to be volatile during 2009, with prices for WTI
ranging from $34 to $81 per barrel. The WTI price averaged
$62 per barrel for the full-year 2009, compared to $100 in
2008. The decline in prices from 2008 was largely associated
with a weakening in global economic conditions and a reduc-
tion in the demand for crude oil and petroleum products. As
of mid-February 2010, the WTI price was about $77.
A differential in crude-oil prices exists between high-
quality (high-gravity, low-sulfur) crudes and those of
lower-quality (low-gravity, high-sulfur). The amount of the
differential in any period is associated with the supply of
heavy crude available versus the demand that is a function of
the number of refineries that are able to process this lower-
quality feedstock into light products (motor gasoline, jet fuel,
aviation gasoline and diesel fuel). The differential remained
narrow through 2009 as production declines in the industry
have been mainly for lower-quality crudes.
Chevron produces or shares in the production of heavy
crude oil in California, Chad, Indonesia, the Partitioned
Zone between Saudi Arabia and Kuwait, Venezuela and in
certain fields in Angola, China and the United Kingdom
WTI Crude Oil and Henry Hub Natural Gas Spot Prices —
Quarterly Average
0
60
150
120
90
30
0
10
25
20
15
5
#009 – Crude Oil Prices 2007 through 2008 – v1
1Q 2Q 3Q 4Q 1Q 1Q2Q 2Q3Q 3Q4Q 4Q
$/mcf$/bbl
2007 2008 2009
WTI
HH
#011 – U.S. Natural Gas Prices – v4
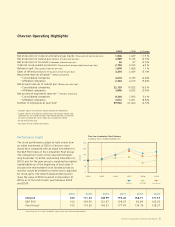
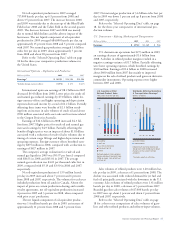
0
2000
150 0
500
1000
0.00
8.00
6.00
4.00
2.00
U.S. Natural Gas Realizations
& Net Production
Prices in Dollars per Thousand
Cubic Feet (right scale)
Production in Millions of
Cubic Feet per Day (left scale)
Average prices decreased 53 percent
to $3.73 during 2009. Production
was 7 percent lower due to natural
field declines and sales of properties.
0605 07 08 09
1,399
0
2000
150 0
1000
500
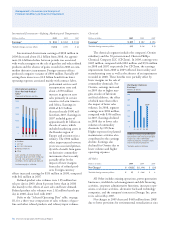
#10B – Net Crude Oil & Nat Gas
Liquids Production (back) – v2
Net Crude Oil & Natural Gas
Liquids Production*
Thousands of barrels per day
United States
International
Net liquids production increased
12 percent in 2009 due mainly to
new projects in the United States
and Nigeria and expansion of
capacity at TCO in Kazakhstan.
* Includes equity in affiliates, but
excludes other produced volumes.
0605 07 08 09
1,8 4 6