Chevron 2009 Annual Report Download - page 84
Download and view the complete annual report
Please find page 84 of the 2009 Chevron annual report below. You can navigate through the pages in the report by either clicking on the pages listed below, or by using the keyword search tool below to find specific information within the annual report.-
 1
1 -
2
-
3
-
4
-
5
-
6
-
7
-
8
-
9
-
10
-
11
-
12
-
13
-
14
-
15
-
16
-
17
-
18
-
19
-
20
-
21
-
22
-
23
-
24
-
25
-
26
-
27
-
28
-
29
-
30
-
31
-
32
-
33
-
34
-
35
-
36
-
37
-
38
-
39
-
40
-
41
-
42
-
43
-
44
-
45
-
46
-
47
-
48
-
49
-
50
-
51
-
52
-
53
-
54
-
55
-
56
-
57
-
58
-
59
-
60
-
61
-
62
-
63
-
64
-
65
-
66
-
67
-
68
-
69
-
70
-
71
-
72
-
73
-
 74
74 -
 75
75 -
 76
76 -
 77
77 -
 78
78 -
 79
79 -
 80
80 -
 81
81 -
 82
82 -
 83
83 -
 84
84 -
 85
85 -
 86
86 -
 87
87 -
 88
88 -
 89
89 -
 90
90 -
 91
91 -
 92
92
 |
 |

FS-PB
82 Chevron Corporation 2009 Annual Report
Supplemental Information on Oil and Gas Producing Activities
with the Angola LNG project accounted for a majority of the
632 BCF increase in Other affiliated companies.
In 2009, net revisions increased reserves by 569 BCF for
consolidated companies and decreased reserves by 44 BCF for
affiliated companies. For consolidated companies, net increases
were 493 BCF in Asia primarily as a result of reservoir studies
in Bangladesh and development drilling in Thailand. These
results were partially offset by a downward revision due to
the impact of higher prices on production-sharing contracts
in Myanmar. The United States and Other regions increased
reserves 39 BCF and 33 BCF, respectively. In the United States,
development drilling in the Gulf of Mexico was partially offset
by performance revisions in the California and mid-continent
areas. In Other regions, improved reservoir performance and
compression in Australia was partially offset by the effect of
higher prices on production-sharing contracts in Trinidad.
For equity affiliates, a downward revision of 237 BCF at
TCO was due to the effect of higher prices on royalty determi-
nation and an increase in gas injection for SGI/SGP facilities.
This decline was partially offset by performance and drilling
opportunities related to the Angola LNG project.
Extensions and Discoveries In 2007, extensions and dis-
coveries accounted for an increase of 518 BCF worldwide.
The largest addition was 330 BCF in Bangladesh, the result
of drilling activities. Other additions were not individually
significant.
In 2009, worldwide extensions and discoveries of 4,387
BCF were attributed to consolidated companies. The Gorgon
Project in Australia accounted for essentially all of the 4,277
BCF additions in the Other regions. In Asia, development drill-
ing in Thailand accounted for the majority of the increase. In
the United States, delineation drilling in California accounted
for the majority of the increase.
Purchases In 2007, purchases of natural gas reserves
were 141 BCF for consolidated companies, which include the
acquisition of an additional interest in the Bibiyana Field in
Bangladesh. Affiliated company purchases of 211 BCF related
to the formation of a new Hamaca equity affiliate in Venezuela
and an initial booking related to the Angola LNG project.
Sales In 2007, sales were 76 BCF and 175 BCF for
consolidated companies and equity affiliates, respectively.
The affiliated company sales related to the dissolution of a
Hamaca equity affiliate in Venezuela.
In 2009, worldwide sales of 117 BCF were related to
consolidated companies. For the Other regions, the sale of
properties in Argentina accounted for 84 BCF. The sale of
properties in the Gulf of Mexico accounted for the majority
of the 33 BCF decrease in the United States.
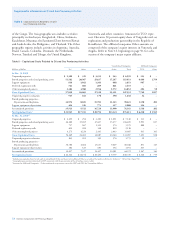
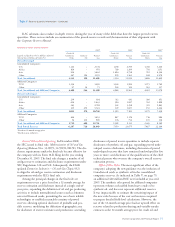
Table VI Standardized Measure of Discounted Future Net Cash
Flows Related to Proved Oil and Gas Reserves
The standardized measure of discounted future net cash
flows, related to the preceding proved oil and gas reserves, is
calculated in accordance with the requirements of the FASB.
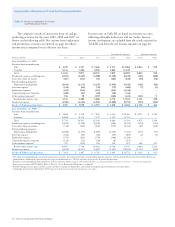
Estimated future cash inflows from production are com-
puted by applying 12 month-average prices for oil and gas to
year-end quantities of estimated net proved reserves. Future
price changes are limited to those provided by contractual
arrangements in existence at the end of each reporting year.
Future development and production costs are those estimated
future expenditures necessary to develop and produce year-
end estimated proved reserves based on year-end cost indices,
assuming continuation of year-end economic conditions,
and include estimated costs for asset retirement obligations.
Estimated future income taxes are calculated by applying
appropriate year-end statutory tax rates. These rates reflect
allowable deductions and tax credits and are applied to
estimated future pretax net cash flows, less the tax basis of
related assets. Discounted future net cash flows are calculated
using 10 percent midperiod discount factors. Discounting
requires a year-by-year estimate of when future expenditures
will be incurred and when reserves will be produced.
The information provided does not represent manage-
ment’s estimate of the company’s expected future cash flows
or value of proved oil and gas reserves. Estimates of proved-
reserve quantities are imprecise and change over time as
new information becomes available. Moreover, probable and
possible reserves, which may become proved in the future,
are excluded from the calculations. The arbitrary valuation
prescribed by the FASB requires assumptions as to the timing
and amount of future development and production costs. The
calculations are made as of December 31 each year and should
not be relied upon as an indication of the company’s future
cash flows or value of its oil and gas reserves. In the following
table, “Standardized Measure Net Cash Flows” refers to the
standardized measure of discounted future net cash flows.