Chevron 2009 Annual Report Download - page 18
Download and view the complete annual report
Please find page 18 of the 2009 Chevron annual report below. You can navigate through the pages in the report by either clicking on the pages listed below, or by using the keyword search tool below to find specific information within the annual report.-
 1
1 -
2
-
3
-
4
-
5
-
6
-
7
-
 8
8 -
 9
9 -
 10
10 -
 11
11 -
 12
12 -
 13
13 -
 14
14 -
 15
15 -
 16
16 -
 17
17 -
 18
18 -
 19
19 -
 20
20 -
 21
21 -
 22
22 -
 23
23 -
 24
24 -
 25
25 -
 26
26 -
 27
27 -
 28
28 -
29
-
30
-
31
-
32
-
33
-
34
-
35
-
36
-
37
-
38
-
39
-
40
-
41
-
42
-
43
-
44
-
45
-
46
-
47
-
48
-
49
-
50
-
51
-
52
-
53
-
54
-
55
-
56
-
57
-
58
-
59
-
60
-
61
-
62
-
63
-
64
-
65
-
66
-
67
-
68
-
69
-
70
-
71
-
72
-
73
-
74
-
75
-
76
-
77
-
78
-
79
-
80
-
81
-
82
-
83
-
84
-
85
-
86
-
87
-
88
-
89
-
90
-
91
-
92
 |
 |
Management’s Discussion and Analysis of
Financial Condition and Results of Operations
16 Chevron Corporation 2009 Annual Report
FS-PB
International Downstream – Refining, Marketing and Transportation
Millions of dollars 2009 2008 2007
Earnings* $ 838 $ 2,060 $ 2,536
*Includes foreign currency effects: $ (213) $ 193 $ 62
International downstream earnings of $838 million in
2009 decreased about $1.2 billion from 2008. An approxi-
mate $2.6 billion decline between periods was associated
with weaker margins on the sale of gasoline and other refined
products and the absence of gains recorded in 2008 on com-
modity derivative instruments. Foreign-currency effects
produced a negative variance of $400 million. Partially off-
setting these items was a $1.0 billion benefit from lower
operating expenses associated mainly with contract labor,
professional services and
transportation costs and
about a $550 million
increase in gains on asset
sales primarily in certain
countries in Latin America
and Africa. Earnings in
2008 of $2.1 billion
decreased nearly $500 mil-
lion from 2007. Earnings in
2007 included gains of
approximately $1 billion on
the sale of assets, which
included marketing assets in
the Benelux region of
Europe and an interest in a
refinery. The $500 million
other improvement between
years was associated primar-
ily with a benefit from gains
on derivative commodity
instruments that was only
partially offset by the
impact of lower margins
from sales of refined prod-
ucts. Foreign-currency
effects increased earnings by $193 million in 2008, compared
with $62 million in 2007.
Refined-product sales volumes were 1.85 million bar-
rels per day in 2009, about 8 percent lower than in 2008
due mainly to the effects of asset sales and lower demand.
Refined-product sales volumes were 2.02 million barrels per
day in 2008, about level with 2007.
Refer to the “Selected Operating Data” table, on page
18, for a three-year comparison of sales volumes of gaso-
line and other refined products and refinery-input volumes.
Chemicals
Millions of dollars 2009 2008 2007
Earnings* $ 409 $ 182 $ 396
*Includes foreign currency effects: $ 15 $ (18) $ (3)
The chemicals segment includes the company’s Oronite
subsidiary and the 50 percent-owned Chevron Phillips
Chemical Company LLC (CPChem). In 2009, earnings were
$409 million, compared with $182 million and $396 million
in 2008 and 2007, respectively. For CPChem, the earnings
improvement from 2008 to 2009 reflected lower utility and
manufacturing costs as well as the absence of an impairment
recorded in 2008. These benefits were partially offset by
lower margins on the sale of
commodity chemicals. For
Oronite, earnings increased
in 2009 due to higher mar-
gins on sales of lubricant
and fuel additives, the effect
of which more than offset
the impact of lower sales
volumes. In 2008, segment
earnings were $182 million,
compared with $396 million
in 2007. Earnings declined
in 2008 due to lower sales
volumes of commodity
chemicals by CPChem.
Higher expenses for planned
maintenance activities also
contributed to the earnings
decline. Earnings also
declined for Oronite due to
lower volumes and higher
operating expenses.
All Other
Millions of dollars 2009 2008 2007
Net Charges* $ (922) $ (1,390) $ (26)
*Includes foreign currency effects: $ 25 $ (186) $ 6
All Other includes mining operations, power generation
businesses, worldwide cash management and debt financing
activities, corporate administrative functions, insurance oper-
ations, real estate activities, alternative fuels and technology
companies, and the company’s interest in Dynegy, Inc. prior
to its sale in May 2007.
Net charges in 2009 decreased $468 million from 2008
due to lower provisions for environmental remediation at sites
0
600
200
100
300
400
500
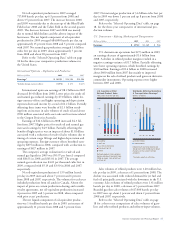
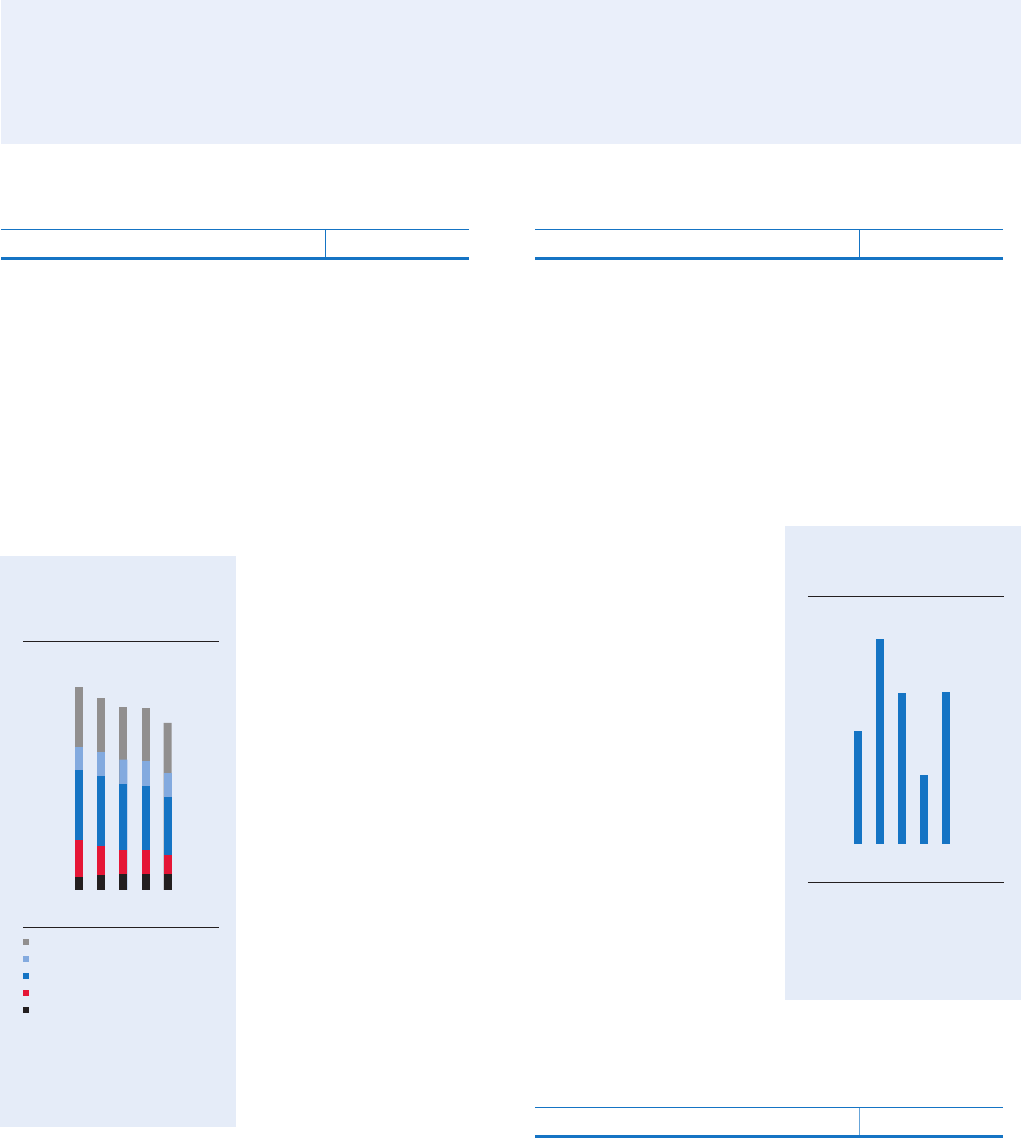
Worldwide Chemicals
Earnings*
Millions of dollars
Chemicals earnings increased about
125 percent from 2008 due to higher
margins on select commodity
chemical products and lower utility
and manufacturing expenses.
*Includes equity in affiliates
0605 07 08 09
$409
#021 – WW Chemicals Earnings – v2
0
2500
2000
150 0
1000
500
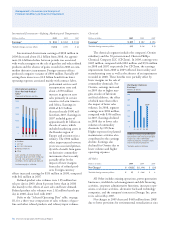
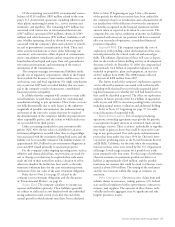
#020 – Int’l. Gasoline & Other
Rened – v2
International Gasoline &
Other Rened-Product
Sales*
Thousands of barrels per day
Sales volumes of refined products
were down 8 percent from 2008 due
to asset sales and weak economic
conditions which depressed demand.
*Includes equity in affiliates
Gasoline
Jet Fuel
Gas Oils & Kerosene
Residual Fuel Oil
Other
0605 07 08 09
1,851