Chevron 2009 Annual Report Download - page 6
Download and view the complete annual report
Please find page 6 of the 2009 Chevron annual report below. You can navigate through the pages in the report by either clicking on the pages listed below, or by using the keyword search tool below to find specific information within the annual report.-
 1
1 -
 2
2 -
 3
3 -
 4
4 -
 5
5 -
 6
6 -
 7
7 -
 8
8 -
 9
9 -
 10
10 -
 11
11 -
 12
12 -
 13
13 -
 14
14 -
 15
15 -
 16
16 -
 17
17 -
18
-
19
-
20
-
21
-
22
-
23
-
24
-
25
-
26
-
27
-
28
-
29
-
30
-
31
-
32
-
33
-
34
-
35
-
36
-
37
-
38
-
39
-
40
-
41
-
42
-
43
-
44
-
45
-
46
-
47
-
48
-
49
-
50
-
51
-
52
-
53
-
54
-
55
-
56
-
57
-
58
-
59
-
60
-
61
-
62
-
63
-
64
-
65
-
66
-
67
-
68
-
69
-
70
-
71
-
72
-
73
-
74
-
75
-
76
-
77
-
78
-
79
-
80
-
81
-
82
-
83
-
84
-
85
-
86
-
87
-
88
-
89
-
90
-
91
-
92
 |
 |
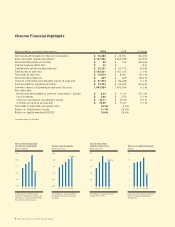
Millions of dollars, except per-share amounts 2009 2008 % Change
Net income attributable to Chevron Corporation $ 10,483 $ 23,931 (56.2)%
Sales and other operating revenues $ 167,402 $ 264,958 (36.8)%
Noncontrolling interests income $ 80 $ 100 (20.0)%
Interest expense (after tax) $ 22 $ — N /A
Capital and exploratory expenditures* $ 22,237 $ 22,775 (2.4)%
Total assets at year-end $ 164,621 $ 161,165 2.1 %
Total debt at year-end $ 10,514 $ 8,901 18.1 %
Noncontrolling interests $ 647 $ 469 38.0 %
Chevron Corporation stockholders’ equity at year-end $ 91,914 $ 86,648 6.1 %
Cash provided by operating activities $ 19,373 $ 29,632 (34.6)%
Common shares outstanding at year-end (Thousands) 1,993,554 1,990,064 0.2 %
Per-share data
Net income attributable to Chevron Corporation – diluted $ 5.24 $ 11.67 (55.1)%
Cash dividends $ 2.66 $ 2.53 5.1 %
Chevron Corporation stockholders’ equity $ 46.11 $ 43.54 5.9 %
Common stock price at year-end $ 76.99 $ 73.97 4.1 %
Total debt to total debt-plus-equity ratio 10.3% 9.3%
Return on stockholders’ equity 11.7% 29.2%
Return on capital employed (ROCE) 10.6% 26.6%
Chevron Financial Highlights
*Includes equity in affiliates
0.0
25.0
20.0
15.0
5.0
10.0
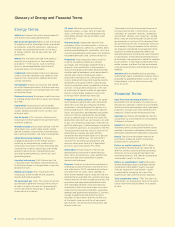
Net Income Attributable
to Chevron Corporation
Billions of dollars
The decrease in 2009 was due
mainly to the decline in earnings for
upstream, as a result of lower prices
for crude oil and natural gas.
05 07 08 09
$10.5
06
0.00
3.00
2.40
1.80
0.60
1.20
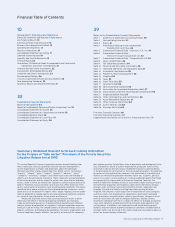
Annual Cash Dividends
Dollars per share
The company’s annual dividend
increased for the 22nd consecu-
tive year.
06
05 07 08 09
$2.66
0
100
80
60
40
20
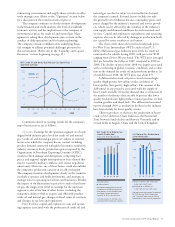
Chevron Year-End
Common Stock Price
Dollars per share
The company’s stock price rose
4.1 percent in 2009.
0605 07 08 09
$76.99
0
30
24
18
12
6
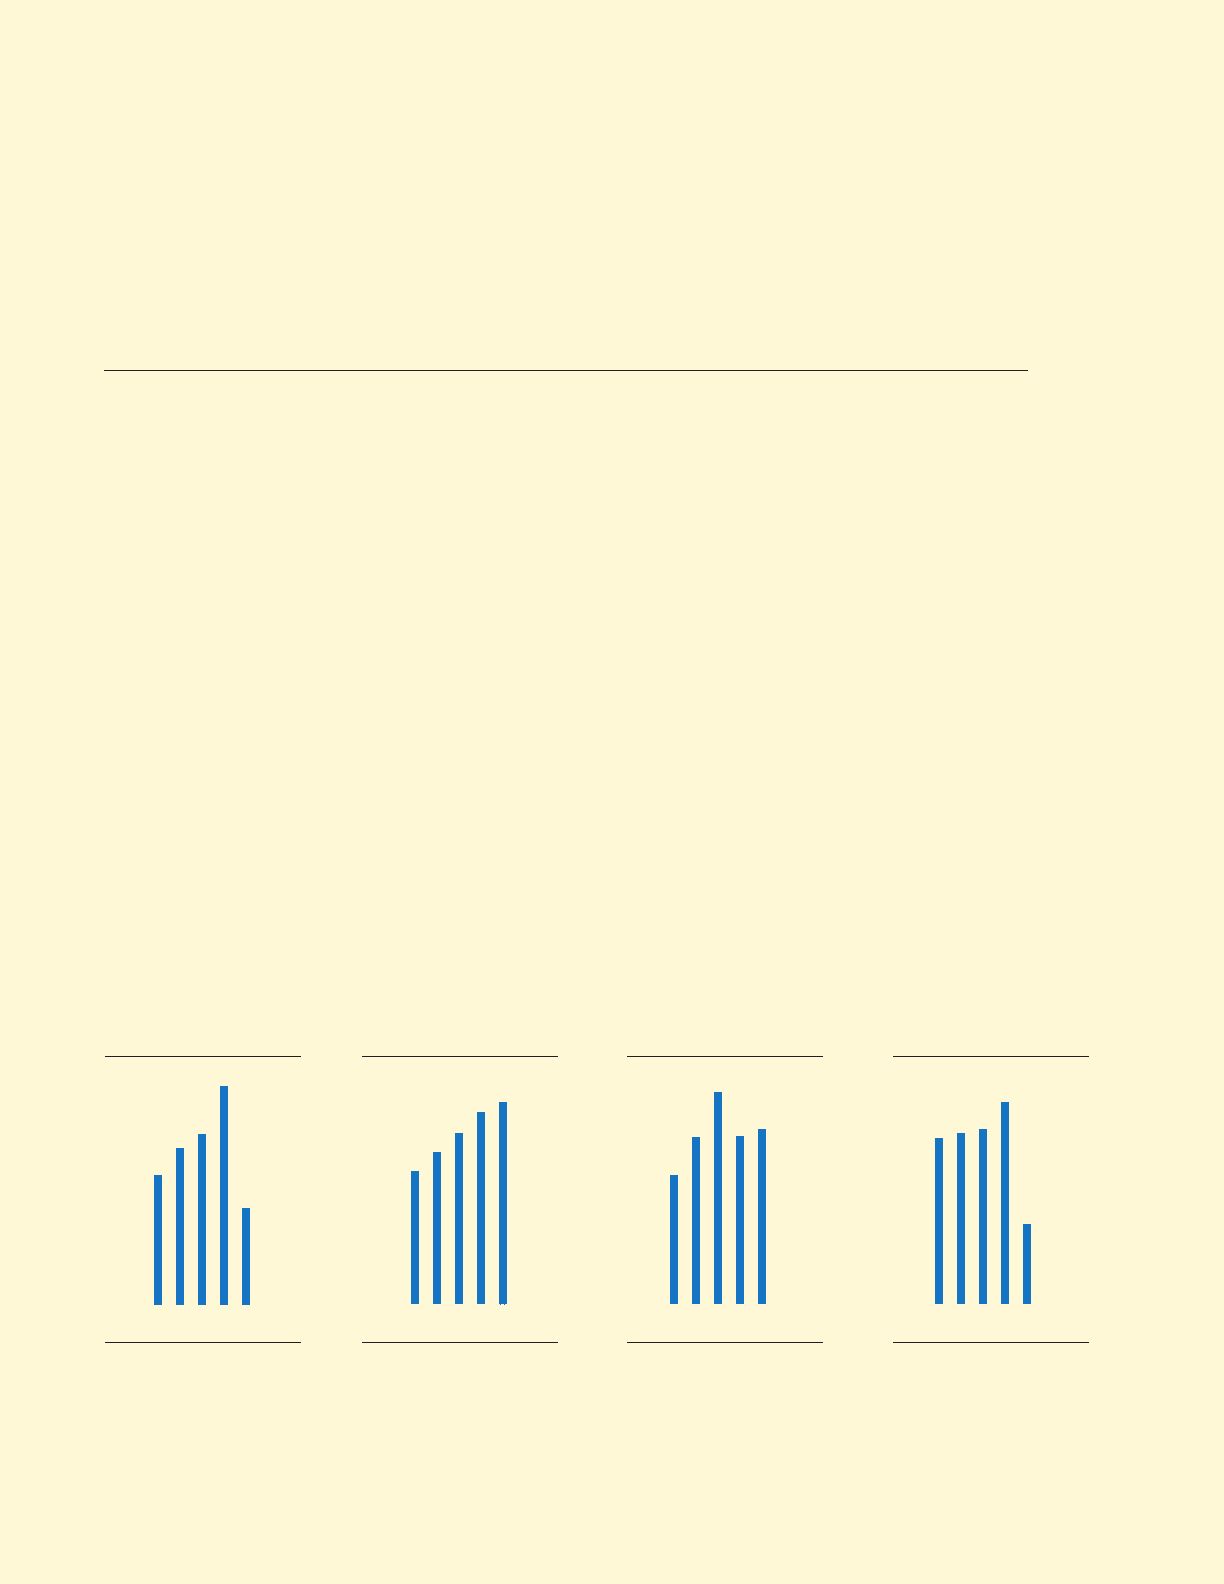
Return on Capital Employed
Percent
Lower earnings reduced Chevron’s
return on capital employed to
10.6 percent.
0 60 5 07 08 09
10.6
4Chevron Corporation 2009 Annual Report
Narrative.cg_R6.indd 4 3/28/10 8:56 AM