Allstate 2011 Annual Report Download - page 54
Download and view the complete annual report
Please find page 54 of the 2011 Allstate annual report below. You can navigate through the pages in the report by either clicking on the pages listed below, or by using the keyword search tool below to find specific information within the annual report.-
 1
1 -
2
-
3
-
4
-
5
-
6
-
7
-
8
-
9
-
10
-
11
-
12
-
13
-
14
-
15
-
16
-
17
-
18
-
19
-
20
-
21
-
22
-
23
-
24
-
25
-
26
-
27
-
28
-
29
-
30
-
31
-
32
-
33
-
34
-
35
-
36
-
37
-
38
-
39
-
40
-
41
-
42
-
43
-
 44
44 -
 45
45 -
 46
46 -
 47
47 -
 48
48 -
 49
49 -
 50
50 -
 51
51 -
 52
52 -
 53
53 -
 54
54 -
 55
55 -
 56
56 -
 57
57 -
 58
58 -
 59
59 -
 60
60 -
 61
61 -
 62
62 -
 63
63 -
 64
64 -
65
-
66
-
67
-
68
-
69
-
70
-
71
-
72
-
73
-
74
-
75
-
76
-
77
-
78
-
79
-
80
-
81
-
82
-
83
-
84
-
85
-
86
-
87
-
88
-
89
-
90
-
91
-
92
-
93
-
94
-
95
-
96
-
97
-
98
-
99
-
100
-
101
-
102
-
103
-
104
-
105
-
106
-
107
-
108
-
109
-
110
-
111
-
112
-
113
-
114
-
115
-
116
-
117
-
118
-
119
-
120
-
121
-
122
-
123
-
124
-
125
-
126
-
127
-
128
-
129
-
130
-
131
-
132
-
133
-
134
-
135
-
136
-
137
-
138
-
139
-
140
-
141
-
142
-
143
-
144
-
145
-
146
-
147
-
148
-
149
-
150
-
151
-
152
-
153
-
154
-
155
-
156
-
157
-
158
-
159
-
160
-
161
-
162
-
163
-
164
-
165
-
166
-
167
-
168
-
169
-
170
-
171
-
172
-
173
-
174
-
175
-
176
-
177
-
178
-
179
-
180
-
181
-
182
-
183
-
184
-
185
-
186
-
187
-
188
-
189
-
190
-
191
-
192
-
193
-
194
-
195
-
196
-
197
-
198
-
199
-
200
-
201
-
202
-
203
-
204
-
205
-
206
-
207
-
208
-
209
-
210
-
211
-
212
-
213
-
214
-
215
-
216
-
217
-
218
-
219
-
220
-
221
-
222
-
223
-
224
-
225
-
226
-
227
-
228
-
229
-
230
-
231
-
232
-
233
-
234
-
235
-
236
-
237
-
238
-
239
-
240
-
241
-
242
-
243
-
244
-
245
-
246
-
247
-
248
-
249
-
250
-
251
-
252
-
253
-
254
-
255
-
256
-
257
-
258
-
259
-
260
-
261
-
262
-
263
-
264
-
265
-
266
-
267
-
268
-
269
-
270
-
271
-
272
-
273
-
274
-
275
-
276
 |
 |

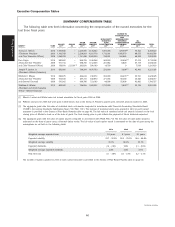
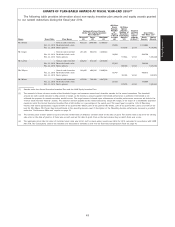
Outstanding Equity Awards at Fiscal Year-End 2010
The following table summarizes the outstanding equity awards of the named executives as of December 31,
2010.
OUTSTANDING EQUITY AWARDS AT FISCAL YEAR-END 2010
Option Awards(1) Stock Awards
Number of Number of Number of
Securities Securities Shares or Market Value
Underlying Underlying Units of of Shares or
Unexercised Unexercised Option Option Stock That Units of Stock
Option Grant Options (#) Options (#) Exercise Expiration Stock Award Have Not That Have Not
Name Date Exercisable(2) Unexercisable(3) Price Date Grant Date Vested (#)(4) Vested(5)
Mr. Wilson May 15, 2001 112,892 0 $42.00 May 15, 2011
Feb. 07, 2002 97,750 0 $33.38 Feb. 07, 2012
Feb. 07, 2003 101,000 0 $31.78 Feb. 07, 2013
Feb. 06, 2004 97,100 0 $45.96 Feb. 06, 2014
Feb. 22, 2005 98,976 0 $52.57 Feb. 22, 2015
June 01, 2005 100,000 0 $58.47 June 01, 2015
Feb. 21, 2006 66,000 0 $53.84 Feb. 21, 2016
Feb. 21, 2006 124,000 0 $53.84 Feb. 21, 2016
Feb. 20, 2007 196,751 65,584 $62.24 Feb. 20, 2017 Feb. 20, 2007 22,385 $ 713,634
Apr. 30, 2007 27,818* 9,273* $62.32 Feb. 07, 2012
Feb. 26, 2008 169,158 169,158 $48.82 Feb. 26, 2018 Feb. 26, 2008 36,705 $1,170,155
Feb. 27, 2009 187,909 563,727 $16.83 Feb. 27, 2019 Feb. 27, 2009 132,264 $4,216,576
Feb. 22, 2010 0 417,576 $31.41 Feb. 22, 2020 Feb. 22, 2010 70,869 $2,259,304
Aggregate
Market Value
$8,359,669
Mr. Civgin Sep. 08, 2008 32,500 32,500 $46.48 Sep. 08, 2018 Sep. 08, 2008 4,300(6) $ 137,084
Feb. 27, 2009 50,375 151,125 $16.83 Feb. 27, 2019 Feb. 27, 2009 35,458 $1,130,401
Feb. 22, 2010 0 111,944 $31.41 Feb. 22, 2020 Feb. 22, 2010 18,999 $ 605,688
Aggregate
Market Value
$1,873,173
Mr. Lacher Dec. 1, 2009 26,125 78,377 $28.52 Dec. 1, 2019 Dec. 1, 2009 18,408(7) $ 586,847
Feb. 22, 2010 0 149,369 $31.41 Feb. 22, 2020 Feb. 22, 2010 25,350 $ 808,158
Aggregate
Market Value
$1,395,005
Ms. Mayes Nov. 12, 2007 75,000 25,000 $53.18 Nov. 12, 2017 Nov. 12, 2007 6,250(8) $ 199,250
Feb. 26, 2008 36,050 36,050 $48.82 Feb. 26, 2018 Feb. 26, 2008 7,800 $ 248,664
Feb. 27, 2009 0 123,409 $16.83 Feb. 27, 2019 Feb. 27, 2009 28,955 $ 923,086
Feb. 22, 2010 0 92,785 $31.41 Feb. 22, 2020 Feb. 22, 2010 15,747 $ 502,014
Aggregate
Market Value
$1,873,014
Mr. Winter Nov. 02, 2009 8,385 25,155 $29.64 Nov. 02, 2019 Nov. 02, 2009 5,904 $ 188,220
Feb. 22, 2010 0 137,879 $31.41 Feb. 22, 2020 Feb. 22, 2010 23,400 $ 745,992
Aggregate
Market Value
$ 934,212
(1) The options granted in 2010 vest in three installments of 50% on the second anniversary date and 25% on each of the third and fourth anniversaries
dates. The other options vest in four installments of 25% on each of the first four anniversaries of the grant date. The exercise price of each option is
equal to the fair market value of Allstate’s common stock on the date of grant. For options granted prior to 2007, fair market value is equal to the average
of high and low sale prices on the date of grant, and for options granted in 2007 and thereafter, fair market value is equal to the closing sale price on
the date of grant or in each case, if there was no sale on the date of grant, then on the last previous day on which there was a sale. An asterisk (*)
denotes reload options issued to replace shares tendered in payment of the exercise price of prior option awards. These reload options are subject to the
same vesting terms and expiration date as the original options including becoming exercisable in four annual installments beginning one year after the
reload option grant date. For option awards granted after 2003, the Committee eliminated the reload feature and no new option awards will be granted
that contain a reload feature.
(2) The aggregate value and aggregate number of exercisable in-the-money options as of December 31, 2010, for each of the named executives is as follows:
Mr. Wilson $2,838,130 (288,909 aggregate number exercisable), Mr. Civgin $758,144 (50,375 aggregate number exercisable), Mr. Lacher $87,780 (26,125
aggregate number exercisable), Ms. Mayes $0 (0 aggregate number exercisable), Mr. Winter $18,782 (8,385 aggregate number exercisable).
(3) The aggregate value and aggregate number of unexercisable in-the-money options as of December 31, 2010, for each of the named executives is as
follows: Mr. Wilson $8,680,352 (981,303 aggregate number unexercisable), Mr. Civgin $2,327,045 (263,069 aggregate number unexercisable), Mr. Lacher
$333,550 (227,746 aggregate number unexercisable), Ms. Mayes $1,900,914 (216,184 aggregate number unexercisable), Mr. Winter $121,150 (163,034
aggregate number unexercisable).
(4) The restricted stock unit awards granted in 2010 vest in three installments of 50% on the second anniversary of the grant date and 25% on each of the
third and fourth anniversary dates. The other restricted stock unit awards vest in one installment on the fourth anniversary of the grant date, unless
otherwise noted.
(5) Amount is based on the closing price of our common stock of $31.88 on December 31, 2010.
(6) Restricted stock units granted as a new hire award. 2,000 restricted stock units vested on the second anniversary of the grant date and the remaining
4,300 restricted stock units vest on the fourth anniversary of the grant date.
(7) Restricted stock units granted as a new hire award. 9,204 restricted stock units vest on the second anniversary of the grant date and the remaining 9,204
restricted stock units vest on the fourth anniversary of the grant date.
(8) Restricted stock units granted as a new hire award. 6,250 restricted stock units vested on the second anniversary of the grant date and the remaining
6,250 restricted stock units vest on the fourth anniversary of the grant date.
44
Proxy Statement