Allstate 2011 Annual Report Download - page 165
Download and view the complete annual report
Please find page 165 of the 2011 Allstate annual report below. You can navigate through the pages in the report by either clicking on the pages listed below, or by using the keyword search tool below to find specific information within the annual report.-
 1
1 -
2
-
3
-
4
-
5
-
6
-
7
-
8
-
9
-
10
-
11
-
12
-
13
-
14
-
15
-
16
-
17
-
18
-
19
-
20
-
21
-
22
-
23
-
24
-
25
-
26
-
27
-
28
-
29
-
30
-
31
-
32
-
33
-
34
-
35
-
36
-
37
-
38
-
39
-
40
-
41
-
42
-
43
-
44
-
45
-
46
-
47
-
48
-
49
-
50
-
51
-
52
-
53
-
54
-
55
-
56
-
57
-
58
-
59
-
60
-
61
-
62
-
63
-
64
-
65
-
66
-
67
-
68
-
69
-
70
-
71
-
72
-
73
-
74
-
75
-
76
-
77
-
78
-
79
-
80
-
81
-
82
-
83
-
84
-
85
-
86
-
87
-
88
-
89
-
90
-
91
-
92
-
93
-
94
-
95
-
96
-
97
-
98
-
99
-
100
-
101
-
102
-
103
-
104
-
105
-
106
-
107
-
108
-
109
-
110
-
111
-
112
-
113
-
114
-
115
-
116
-
117
-
118
-
119
-
120
-
121
-
122
-
123
-
124
-
125
-
126
-
127
-
128
-
129
-
130
-
131
-
132
-
133
-
134
-
135
-
136
-
137
-
138
-
139
-
140
-
141
-
142
-
143
-
144
-
145
-
146
-
147
-
148
-
149
-
150
-
151
-
152
-
153
-
154
-
 155
155 -
 156
156 -
 157
157 -
 158
158 -
 159
159 -
 160
160 -
 161
161 -
 162
162 -
 163
163 -
 164
164 -
 165
165 -
 166
166 -
 167
167 -
 168
168 -
 169
169 -
 170
170 -
 171
171 -
 172
172 -
 173
173 -
 174
174 -
 175
175 -
176
-
177
-
178
-
179
-
180
-
181
-
182
-
183
-
184
-
185
-
186
-
187
-
188
-
189
-
190
-
191
-
192
-
193
-
194
-
195
-
196
-
197
-
198
-
199
-
200
-
201
-
202
-
203
-
204
-
205
-
206
-
207
-
208
-
209
-
210
-
211
-
212
-
213
-
214
-
215
-
216
-
217
-
218
-
219
-
220
-
221
-
222
-
223
-
224
-
225
-
226
-
227
-
228
-
229
-
230
-
231
-
232
-
233
-
234
-
235
-
236
-
237
-
238
-
239
-
240
-
241
-
242
-
243
-
244
-
245
-
246
-
247
-
248
-
249
-
250
-
251
-
252
-
253
-
254
-
255
-
256
-
257
-
258
-
259
-
260
-
261
-
262
-
263
-
264
-
265
-
266
-
267
-
268
-
269
-
270
-
271
-
272
-
273
-
274
-
275
-
276
 |
 |

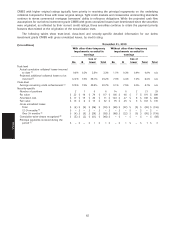
anticipated recoveries, prepayment rates, changes in interest rates and other characteristics. In addition, the
performance of collateral underlying certain of our securities is actively monitored by external managers, allowing for
enhanced collateral management actions which help mitigate the risk of loss. If the overcollateralization that exists for
our class exceeds 100%, our class has remaining credit enhancement sufficient to withstand the projected future losses,
and we expect to collect all contractual principal and interest of the security we own.
For securities where there is insufficient remaining credit enhancement for the class of securities we own, a
recovery value is calculated based on our best estimate of future cash flows specific to that security. This estimate is
based on the contractual principal payments and current interest payments of the securities we own, adjusted for actual
cumulative collateral losses incurred to date and the projected future losses expected to be incurred. If we do not expect
to receive cash flows sufficient to recover the entire amortized cost basis of the security, a credit loss is recorded to the
extent amortized cost exceeds recovery value.
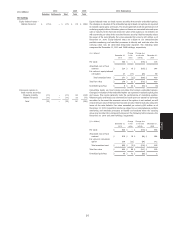
The weighted average overcollateralization ratio as reported by the trust servicers for our below investment grade
cash flow CLO securities with gross unrealized losses was 117.0% as of December 31, 2010, compared to 117.5% at
original issuance. As of December 31, 2009, the weighted average overcollateralization ratio for our below investment
grade cash flow CLO securities with gross unrealized losses was 113.6%. As the average overcollateralization ratios
exceed 100%, this indicates that projected future collateral losses will be absorbed by lower classes and we expect the
structures to have adequate cash flows to make all contractual payments due to the class of securities we own. Our
comprehensive evaluation of financial, economic and capital markets assumptions developed for this reporting period,
supported by the applicable overcollateralization ratios, indicates that the nature of the unrealized loss on these
securities is temporary.
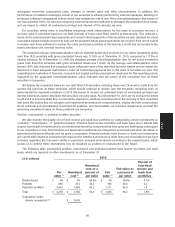
We believe the unrealized losses on our cash flow CLO securities, including those over 24 months, result from the
current risk premium on these securities, which should continue to reverse over the securities’ remaining lives, as
demonstrated by improved valuations in 2010. We expect to receive our estimated share of contractual principal and
interest collections used to determine the securities’ recovery value. As of December 31, 2010, we do not have the intent
to sell and it is not more likely than not we will be required to sell these securities before the recovery of their amortized
cost basis. We believe that our valuation and impairment processes are comprehensive, employ the most current views
about collateral and securitization trust financial positions, and demonstrate our recorded impairments and that the
remaining unrealized losses on these positions are temporary.
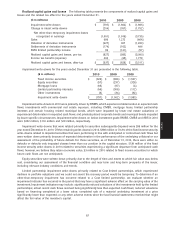
Problem, restructured, or potential problem securities
We also monitor the quality of our fixed income and bank loan portfolios by categorizing certain investments as
‘‘problem,’’ ‘‘restructured,’’ or ‘‘potential problem.’’ Problem fixed income securities and bank loans are in default with
respect to principal or interest and/or are investments issued by companies that have gone into bankruptcy subsequent
to our acquisition or loan. Fixed income and bank loan investments are categorized as restructured when the debtor is
experiencing financial difficulty and we grant a concession. Potential problem fixed income or bank loan investments
are current with respect to contractual principal and/or interest, but because of other facts and circumstances, we have
concerns regarding the borrower’s ability to pay future principal and interest according to the original terms, which
causes us to believe these investments may be classified as problem or restructured in the future.
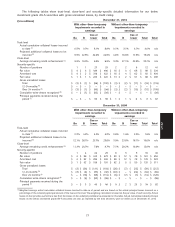
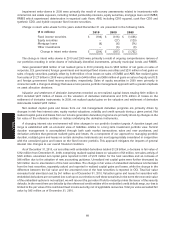
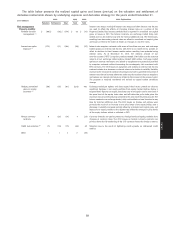
The following table summarizes problem, restructured and potential problem fixed income securities and bank
loans, which are reported in other investments, as of December 31.
2010
($ in millions)
Percent of
Amortized total fixed
cost as a Fair value as income and
Par Amortized percent of Fair a percent of bank loan
value (1) cost (1) par value value (2) par value portfolios
Restructured $ 99 $ 83 83.8% $ 79 79.8% 0.1%
Problem 665 214 32.2 188 28.3 0.2
Potential problem 3,441 1,485 43.2 1,171 34.0 1.5
Total $ 4,205 $ 1,782 42.4 $ 1,438 34.2 1.8%
Cumulative write-
downs recognized (3) $ 1,005
85
MD&A