Allstate 2011 Annual Report Download - page 42
Download and view the complete annual report
Please find page 42 of the 2011 Allstate annual report below. You can navigate through the pages in the report by either clicking on the pages listed below, or by using the keyword search tool below to find specific information within the annual report.-
 1
1 -
2
-
3
-
4
-
5
-
6
-
7
-
8
-
9
-
10
-
11
-
12
-
13
-
14
-
15
-
16
-
17
-
18
-
19
-
20
-
21
-
22
-
23
-
24
-
25
-
26
-
27
-
28
-
29
-
30
-
31
-
 32
32 -
 33
33 -
 34
34 -
 35
35 -
 36
36 -
 37
37 -
 38
38 -
 39
39 -
 40
40 -
 41
41 -
 42
42 -
 43
43 -
 44
44 -
 45
45 -
 46
46 -
 47
47 -
 48
48 -
 49
49 -
 50
50 -
 51
51 -
 52
52 -
53
-
54
-
55
-
56
-
57
-
58
-
59
-
60
-
61
-
62
-
63
-
64
-
65
-
66
-
67
-
68
-
69
-
70
-
71
-
72
-
73
-
74
-
75
-
76
-
77
-
78
-
79
-
80
-
81
-
82
-
83
-
84
-
85
-
86
-
87
-
88
-
89
-
90
-
91
-
92
-
93
-
94
-
95
-
96
-
97
-
98
-
99
-
100
-
101
-
102
-
103
-
104
-
105
-
106
-
107
-
108
-
109
-
110
-
111
-
112
-
113
-
114
-
115
-
116
-
117
-
118
-
119
-
120
-
121
-
122
-
123
-
124
-
125
-
126
-
127
-
128
-
129
-
130
-
131
-
132
-
133
-
134
-
135
-
136
-
137
-
138
-
139
-
140
-
141
-
142
-
143
-
144
-
145
-
146
-
147
-
148
-
149
-
150
-
151
-
152
-
153
-
154
-
155
-
156
-
157
-
158
-
159
-
160
-
161
-
162
-
163
-
164
-
165
-
166
-
167
-
168
-
169
-
170
-
171
-
172
-
173
-
174
-
175
-
176
-
177
-
178
-
179
-
180
-
181
-
182
-
183
-
184
-
185
-
186
-
187
-
188
-
189
-
190
-
191
-
192
-
193
-
194
-
195
-
196
-
197
-
198
-
199
-
200
-
201
-
202
-
203
-
204
-
205
-
206
-
207
-
208
-
209
-
210
-
211
-
212
-
213
-
214
-
215
-
216
-
217
-
218
-
219
-
220
-
221
-
222
-
223
-
224
-
225
-
226
-
227
-
228
-
229
-
230
-
231
-
232
-
233
-
234
-
235
-
236
-
237
-
238
-
239
-
240
-
241
-
242
-
243
-
244
-
245
-
246
-
247
-
248
-
249
-
250
-
251
-
252
-
253
-
254
-
255
-
256
-
257
-
258
-
259
-
260
-
261
-
262
-
263
-
264
-
265
-
266
-
267
-
268
-
269
-
270
-
271
-
272
-
273
-
274
-
275
-
276
 |
 |

Peer Insurance Companies
ACE Ltd.* Manulife Financial Corporation*
AFLAC Inc.* MetLife Inc.
The Chubb Corporation The Progressive Corporation
The Hartford Financial Services Group, Inc. Prudential Financial, Inc.
Lincoln National Corporation The Travelers Companies, Inc.
* Added in 2010
In addition, in its executive pay discussions, the Committee considers proxy information from select S&P 100
companies that had between $15 and $60 billion in fiscal 2009 revenue. These are publicly traded companies with
which we compete for executive talent.
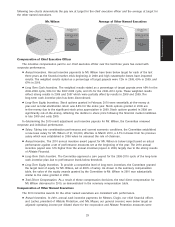
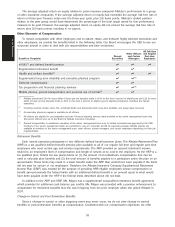
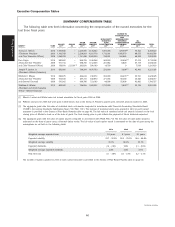
Core Elements of Executive Compensation Program
Our executive compensation program design balances fixed and variable compensation elements and
provides alignment with both short and long term business goals through annual and long-term incentives. Our
incentives are designed to balance overall corporate, business unit, and individual performance with respect to
measures we believe correlate to the creation of stockholder value and align with our strategic vision and
operating priorities. The following table lists the core elements of our executive compensation program.
Potential for Variability
Core Element Purpose with Performance
Annual salary Provides a base level of competitive cash
compensation for executive talent Low
Annual cash incentive awards Reward performance on key strategic, operational,
and financial measures over the year High
Long-term equity incentive Align the interests of executives with long-term
awards shareholder value and retain executive talent Moderate to High
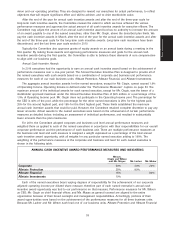
Salary
Executive salaries are set by the Board based on the recommendations of the Committee. In recommending
executive base salary levels, the Committee uses the 50th percentile of our peer insurance companies as a
guideline to align with Allstate’s pay philosophy for competitive positioning in the market for executive talent.
●The average enterprise-wide merit and promotional increases are based on a combination of U.S. general
and insurance industry market data and are set at levels intended to be competitive.
●Annual merit increases for the named executives other than the CEO are based on evaluations of their
performance by the CEO, the Committee, and the Board, using the average enterprise-wide merit increase
as a guideline. An annual merit increase for the CEO is based on an evaluation by the Committee and the
Board of his performance and market conditions.
●Mr. Wilson began fiscal year 2010 with an annual base salary of $1,060,000, which was established in
2008 when he assumed the role of Chairman. The Committee established a new base salary of
$1,100,000, effective in March of 2010, taking into consideration his performance and current economic
conditions.
●The Committee reviewed the base salaries for each other named executive in February of 2010. The
Committee established a new base salary for Mr. Civgin and Ms. Mayes based on individual
performance and in line with the enterprise-wide merit increase. Mr. Civgin’s salary was $550,000, and
the Committee approved an increase to $565,000. Ms. Mayes’ salary was $554,190, and the Committee
approved an increase to $568,000.
●The Committee did not adjust the base salaries for Messrs. Lacher and Winter, which had just been
established in the last quarter of 2009 when they joined the corporation.
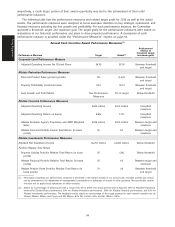
Incentive Compensation
The Committee approves performance measures and goals for cash incentive awards during the first quarter
of the year. The performance measures and goals are aligned with Allstate’s objectives and tied to our strategic
32
Proxy Statement