Allstate 2011 Annual Report Download - page 205
Download and view the complete annual report
Please find page 205 of the 2011 Allstate annual report below. You can navigate through the pages in the report by either clicking on the pages listed below, or by using the keyword search tool below to find specific information within the annual report.-
 1
1 -
2
-
3
-
4
-
5
-
6
-
7
-
8
-
9
-
10
-
11
-
12
-
13
-
14
-
15
-
16
-
17
-
18
-
19
-
20
-
21
-
22
-
23
-
24
-
25
-
26
-
27
-
28
-
29
-
30
-
31
-
32
-
33
-
34
-
35
-
36
-
37
-
38
-
39
-
40
-
41
-
42
-
43
-
44
-
45
-
46
-
47
-
48
-
49
-
50
-
51
-
52
-
53
-
54
-
55
-
56
-
57
-
58
-
59
-
60
-
61
-
62
-
63
-
64
-
65
-
66
-
67
-
68
-
69
-
70
-
71
-
72
-
73
-
74
-
75
-
76
-
77
-
78
-
79
-
80
-
81
-
82
-
83
-
84
-
85
-
86
-
87
-
88
-
89
-
90
-
91
-
92
-
93
-
94
-
95
-
96
-
97
-
98
-
99
-
100
-
101
-
102
-
103
-
104
-
105
-
106
-
107
-
108
-
109
-
110
-
111
-
112
-
113
-
114
-
115
-
116
-
117
-
118
-
119
-
120
-
121
-
122
-
123
-
124
-
125
-
126
-
127
-
128
-
129
-
130
-
131
-
132
-
133
-
134
-
135
-
136
-
137
-
138
-
139
-
140
-
141
-
142
-
143
-
144
-
145
-
146
-
147
-
148
-
149
-
150
-
151
-
152
-
153
-
154
-
155
-
156
-
157
-
158
-
159
-
160
-
161
-
162
-
163
-
164
-
165
-
166
-
167
-
168
-
169
-
170
-
171
-
172
-
173
-
174
-
175
-
176
-
177
-
178
-
179
-
180
-
181
-
182
-
183
-
184
-
185
-
186
-
187
-
188
-
189
-
190
-
191
-
192
-
193
-
194
-
 195
195 -
 196
196 -
 197
197 -
 198
198 -
 199
199 -
 200
200 -
 201
201 -
 202
202 -
 203
203 -
 204
204 -
 205
205 -
 206
206 -
 207
207 -
 208
208 -
 209
209 -
 210
210 -
 211
211 -
 212
212 -
 213
213 -
 214
214 -
 215
215 -
216
-
217
-
218
-
219
-
220
-
221
-
222
-
223
-
224
-
225
-
226
-
227
-
228
-
229
-
230
-
231
-
232
-
233
-
234
-
235
-
236
-
237
-
238
-
239
-
240
-
241
-
242
-
243
-
244
-
245
-
246
-
247
-
248
-
249
-
250
-
251
-
252
-
253
-
254
-
255
-
256
-
257
-
258
-
259
-
260
-
261
-
262
-
263
-
264
-
265
-
266
-
267
-
268
-
269
-
270
-
271
-
272
-
273
-
274
-
275
-
276
 |
 |

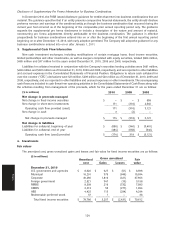
($ in millions) Gross unrealized
Amortized Fair
cost Gains Losses value
December 31, 2009
U.S. government and agencies $ 7,333 $ 219 $ (16) $ 7,536
Municipal 21,683 537 (940) 21,280
Corporate 32,770 1,192 (847) 33,115
Foreign government 2,906 306 (15) 3,197
RMBS 9,487 130 (1,630) 7,987
CMBS 3,511 30 (955) 2,586
ABS 3,514 62 (550) 3,026
Redeemable preferred stock 39 1 (1) 39
Total fixed income securities $ 81,243 $ 2,477 $ (4,954) $ 78,766
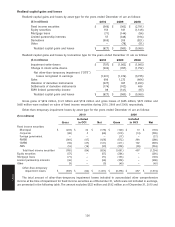
Scheduled maturities
The scheduled maturities for fixed income securities are as follows as of December 31, 2010:
($ in millions) Amortized Fair
cost value
Due in one year or less $ 3,147 $ 3,185
Due after one year through five years 23,905 24,688
Due after five years through ten years 16,551 17,484
Due after ten years 22,249 22,018
65,852 67,375
RMBS and ABS 12,934 12,237
Total $ 78,786 $ 79,612
Actual maturities may differ from those scheduled as a result of prepayments by the issuers. Because of the
potential for prepayment on RMBS and ABS, they are not categorized by contractual maturity. CMBS are categorized by
contractual maturity because they generally are not subject to prepayment risk.
Net investment income
Net investment income for the years ended December 31 is as follows:
($ in millions) 2010 2009 2008
Fixed income securities $ 3,737 $ 3,998 $ 4,783
Equity securities 90 80 120
Mortgage loans 385 498 618
Limited partnership interests 40 17 62
Short-term investments 8 27 195
Other 19 (10) 54
Investment income, before expense 4,279 4,610 5,832
Investment expense (177) (166) (210)
Net investment income $ 4,102 $ 4,444 $ 5,622
125
Notes