Allstate 2011 Annual Report Download - page 185
Download and view the complete annual report
Please find page 185 of the 2011 Allstate annual report below. You can navigate through the pages in the report by either clicking on the pages listed below, or by using the keyword search tool below to find specific information within the annual report.-
 1
1 -
2
-
3
-
4
-
5
-
6
-
7
-
8
-
9
-
10
-
11
-
12
-
13
-
14
-
15
-
16
-
17
-
18
-
19
-
20
-
21
-
22
-
23
-
24
-
25
-
26
-
27
-
28
-
29
-
30
-
31
-
32
-
33
-
34
-
35
-
36
-
37
-
38
-
39
-
40
-
41
-
42
-
43
-
44
-
45
-
46
-
47
-
48
-
49
-
50
-
51
-
52
-
53
-
54
-
55
-
56
-
57
-
58
-
59
-
60
-
61
-
62
-
63
-
64
-
65
-
66
-
67
-
68
-
69
-
70
-
71
-
72
-
73
-
74
-
75
-
76
-
77
-
78
-
79
-
80
-
81
-
82
-
83
-
84
-
85
-
86
-
87
-
88
-
89
-
90
-
91
-
92
-
93
-
94
-
95
-
96
-
97
-
98
-
99
-
100
-
101
-
102
-
103
-
104
-
105
-
106
-
107
-
108
-
109
-
110
-
111
-
112
-
113
-
114
-
115
-
116
-
117
-
118
-
119
-
120
-
121
-
122
-
123
-
124
-
125
-
126
-
127
-
128
-
129
-
130
-
131
-
132
-
133
-
134
-
135
-
136
-
137
-
138
-
139
-
140
-
141
-
142
-
143
-
144
-
145
-
146
-
147
-
148
-
149
-
150
-
151
-
152
-
153
-
154
-
155
-
156
-
157
-
158
-
159
-
160
-
161
-
162
-
163
-
164
-
165
-
166
-
167
-
168
-
169
-
170
-
171
-
172
-
173
-
174
-
 175
175 -
 176
176 -
 177
177 -
 178
178 -
 179
179 -
 180
180 -
 181
181 -
 182
182 -
 183
183 -
 184
184 -
 185
185 -
 186
186 -
 187
187 -
 188
188 -
 189
189 -
 190
190 -
 191
191 -
 192
192 -
 193
193 -
 194
194 -
 195
195 -
196
-
197
-
198
-
199
-
200
-
201
-
202
-
203
-
204
-
205
-
206
-
207
-
208
-
209
-
210
-
211
-
212
-
213
-
214
-
215
-
216
-
217
-
218
-
219
-
220
-
221
-
222
-
223
-
224
-
225
-
226
-
227
-
228
-
229
-
230
-
231
-
232
-
233
-
234
-
235
-
236
-
237
-
238
-
239
-
240
-
241
-
242
-
243
-
244
-
245
-
246
-
247
-
248
-
249
-
250
-
251
-
252
-
253
-
254
-
255
-
256
-
257
-
258
-
259
-
260
-
261
-
262
-
263
-
264
-
265
-
266
-
267
-
268
-
269
-
270
-
271
-
272
-
273
-
274
-
275
-
276
 |
 |

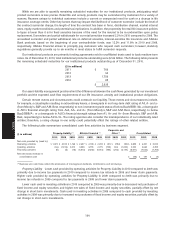
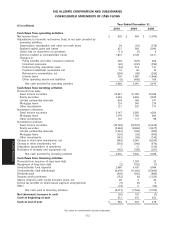
Allstate Financial Operating cash flows for Allstate Financial in 2010 were higher than 2009 as higher premiums
and tax refunds received were partially offset by lower investment income and higher contract benefits paid. Operating
cash flows for Allstate Financial in 2009 were consistent with 2008 as higher income tax refunds and lower expenses
were offset by lower net investment income. The increase in income tax refunds received in 2009 was related to the
carryback of 2008 ordinary losses to prior tax years.
Cash flows provided by investing activities in 2010 and 2009 were impacted by reductions of investments to fund
reductions in contractholder fund liabilities.
Lower cash flows used in financing activities in 2010 compared to 2009 were primarily due to decreased maturities
and retirements of institutional products, partially offset by lower deposits on fixed annuities. Higher cash flows used in
financing activities in 2009 compared to 2008 were primarily due to the absence of issuances of institutional products in
2009 compared to $4.16 billion in 2008 and lower deposits on fixed annuities, partially offset by lower maturities and
retirements of institutional products. For quantification of the changes in contractholder funds, see the Allstate
Financial Segment section of the MD&A.
Corporate and Other Fluctuations in the Corporate and Other operating cash flows were primarily due to the
timing of intercompany settlements. Investing activities primarily relate to investments in the portfolios of Kennett
Capital Holdings, LLC. Financing cash flows of the Corporate and Other segment reflect actions such as fluctuations in
short-term debt, repayment of debt, proceeds from the issuance of debt, dividends to shareholders of The Allstate
Corporation and share repurchases; therefore, financing cash flows are affected when we increase or decrease the level
of these activities.
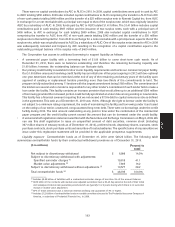
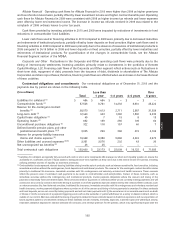
Contractual obligations and commitments Our contractual obligations as of December 31, 2010 and the
payments due by period are shown in the following table.
($ in millions) Less than Over
Total 1 year 1-3 years 4-5 years 5 years
Liabilities for collateral (1) $ 484 $ 484 $ — $ — $ —
Contractholder funds (2) 57,525 8,761 14,232 9,310 25,222
Reserve for life-contingent contract
benefits (2) 38,070 1,413 2,711 2,587 31,359
Long-term debt (3) 12,443 403 1,280 1,530 9,230
Capital lease obligations (3) 45 7 15 8 15
Operating leases (3) 632 199 260 109 64
Unconditional purchase obligations (3) 322 118 157 40 7
Defined benefit pension plans and other
postretirement benefit plans (3)(4) 3,035 299 266 274 2,196
Reserve for property-liability insurance
claims and claims expense (5) 19,468 8,388 5,886 2,224 2,970
Other liabilities and accrued expenses (6)(7) 3,351 3,076 202 43 30
Net unrecognized tax benefits (8) 2525———
Total contractual cash obligations $ 135,400 $ 23,173 $ 25,009 $ 16,125 $ 71,093
(1) Liabilities for collateral are typically fully secured with cash or short-term investments. We manage our short-term liquidity position to ensure the
availability of a sufficient amount of liquid assets to extinguish short-term liabilities as they come due in the normal course of business, including
utilizing potential sources of liquidity as disclosed previously.
(2) Contractholder funds represent interest-bearing liabilities arising from the sale of products such as interest-sensitive life, fixed annuities, including
immediate annuities without life contingencies, bank deposits and institutional products. The reserve for life-contingent contract benefits relates
primarily to traditional life insurance, immediate annuities with life contingencies and voluntary accident and health insurance. These amounts
reflect the present value of estimated cash payments to be made to contractholders and policyholders. Certain of these contracts, such as
immediate annuities without life contingencies and institutional products, involve payment obligations where the amount and timing of the
payment is essentially fixed and determinable. These amounts relate to (i) policies or contracts where we are currently making payments and will
continue to do so and (ii) contracts where the timing of a portion or all of the payments has been determined by the contract. Other contracts, such
as interest-sensitive life, fixed deferred annuities, traditional life insurance, immediate annuities with life contingencies and voluntary accident and
health insurance, involve payment obligations where a portion or all of the amount and timing of future payments is uncertain. For these contracts
and bank deposits, we are not currently making payments and will not make payments until (i) the occurrence of an insurable event such as death
or illness or (ii) the occurrence of a payment triggering event such as the surrender or partial withdrawal on a policy or deposit contract, which is
outside of our control. We have estimated the timing of payments related to these contracts based on historical experience and our expectation of
future payment patterns. Uncertainties relating to these liabilities include mortality, morbidity, expenses, customer lapse and withdrawal activity,
estimated additional deposits for interest-sensitive life contracts, and renewal premium for life policies, which may significantly impact both the
105
MD&A