Allstate 2011 Annual Report Download - page 143
Download and view the complete annual report
Please find page 143 of the 2011 Allstate annual report below. You can navigate through the pages in the report by either clicking on the pages listed below, or by using the keyword search tool below to find specific information within the annual report.-
 1
1 -
2
-
3
-
4
-
5
-
6
-
7
-
8
-
9
-
10
-
11
-
12
-
13
-
14
-
15
-
16
-
17
-
18
-
19
-
20
-
21
-
22
-
23
-
24
-
25
-
26
-
27
-
28
-
29
-
30
-
31
-
32
-
33
-
34
-
35
-
36
-
37
-
38
-
39
-
40
-
41
-
42
-
43
-
44
-
45
-
46
-
47
-
48
-
49
-
50
-
51
-
52
-
53
-
54
-
55
-
56
-
57
-
58
-
59
-
60
-
61
-
62
-
63
-
64
-
65
-
66
-
67
-
68
-
69
-
70
-
71
-
72
-
73
-
74
-
75
-
76
-
77
-
78
-
79
-
80
-
81
-
82
-
83
-
84
-
85
-
86
-
87
-
88
-
89
-
90
-
91
-
92
-
93
-
94
-
95
-
96
-
97
-
98
-
99
-
100
-
101
-
102
-
103
-
104
-
105
-
106
-
107
-
108
-
109
-
110
-
111
-
112
-
113
-
114
-
115
-
116
-
117
-
118
-
119
-
120
-
121
-
122
-
123
-
124
-
125
-
126
-
127
-
128
-
129
-
130
-
131
-
132
-
 133
133 -
 134
134 -
 135
135 -
 136
136 -
 137
137 -
 138
138 -
 139
139 -
 140
140 -
 141
141 -
 142
142 -
 143
143 -
 144
144 -
 145
145 -
 146
146 -
 147
147 -
 148
148 -
 149
149 -
 150
150 -
 151
151 -
 152
152 -
 153
153 -
154
-
155
-
156
-
157
-
158
-
159
-
160
-
161
-
162
-
163
-
164
-
165
-
166
-
167
-
168
-
169
-
170
-
171
-
172
-
173
-
174
-
175
-
176
-
177
-
178
-
179
-
180
-
181
-
182
-
183
-
184
-
185
-
186
-
187
-
188
-
189
-
190
-
191
-
192
-
193
-
194
-
195
-
196
-
197
-
198
-
199
-
200
-
201
-
202
-
203
-
204
-
205
-
206
-
207
-
208
-
209
-
210
-
211
-
212
-
213
-
214
-
215
-
216
-
217
-
218
-
219
-
220
-
221
-
222
-
223
-
224
-
225
-
226
-
227
-
228
-
229
-
230
-
231
-
232
-
233
-
234
-
235
-
236
-
237
-
238
-
239
-
240
-
241
-
242
-
243
-
244
-
245
-
246
-
247
-
248
-
249
-
250
-
251
-
252
-
253
-
254
-
255
-
256
-
257
-
258
-
259
-
260
-
261
-
262
-
263
-
264
-
265
-
266
-
267
-
268
-
269
-
270
-
271
-
272
-
273
-
274
-
275
-
276
 |
 |

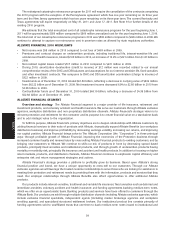
Non-deferrable acquisition costs increased 2.0% or $3 million in 2009 compared to 2008 primarily due to higher
non-deferrable commissions related to accident and health insurance business sold through Allstate Benefits. Other
operating costs and expenses decreased 25.3% or $93 million in 2009 compared to 2008 primarily due to our expense
reduction actions, which resulted in lower employee, professional services and sales support expenses.
During 2009, restructuring and related charges of $25 million were recorded in connection with our previously
announced plan to improve efficiency and narrow our focus of product offerings. In accordance with this plan, among
other actions, we eliminated approximately 1,000 workforce positions relative to December 31, 2008 levels through a
combination of attrition, position elimination and outsourcing. This reduction reflected approximately 30% of Allstate
Financial’s work force at the time the plan was initiated. Through our actions completed as of December 31, 2010, we
anticipate that we will exceed our targeted annual savings of $90 million beginning in 2011.
Income tax expense of $8 million was recognized for 2010 compared to income tax benefits of $82 million and
$954 million in 2009 and 2008, respectively. Income tax benefit for 2009 included expense of $142 million attributable to
an increase in the valuation allowance relating to the deferred tax asset on capital losses recorded in the first quarter of
2009. This valuation allowance was released in connection with the adoption of new OTTI accounting guidance on
April 1, 2009; however, the release was recorded as an increase to retained income and therefore did not reverse the
amount recorded in income tax benefit.
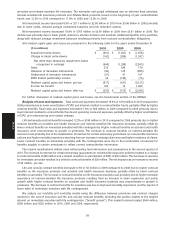
Reinsurance ceded We enter into reinsurance agreements with unaffiliated reinsurers to limit our risk of
mortality and morbidity losses. In addition, Allstate Financial has used reinsurance to effect the acquisition or
disposition of certain blocks of business. We retain primary liability as a direct insurer for all risks ceded to reinsurers. As
of December 31, 2010 and 2009, 45% and 47%, respectively, of our face amount of life insurance in force was reinsured.
Additionally, we ceded substantially all of the risk associated with our variable annuity business and we cede 100% of
the morbidity risk on substantially all of our long-term care contracts.
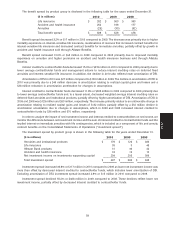
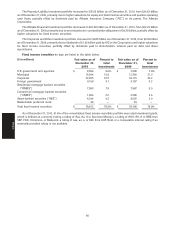
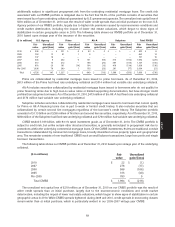
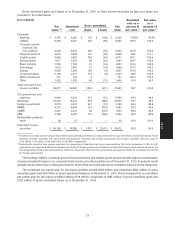
Our reinsurance recoverables, summarized by reinsurer as of December 31, are shown in the following table.
($ in millions) Standard & Poor’s Reinsurance
Financial recoverable on paid
Strength Rating (3) and unpaid benefits
2010 2009
Prudential Insurance Company of America AA- $ 1,633 $ 1,507
Employers Reassurance Corporation A+ 853 745
Transamerica Life Group AA- 402 374
RGA Reinsurance Company AA- 360 352
Swiss Re Life and Health America, Inc. A+ 210 200
Paul Revere Life Insurance Company A- 140 146
Scottish Re Group (1) N/A 136 137
Munich American Reassurance AA- 124 119
Mutual of Omaha Insurance AA- 98 101
Security Life of Denver A 79 91
Manulife Insurance Company AA- 68 71
Lincoln National Life Insurance AA- 64 65
Triton Insurance Company N/A 58 61
American Health & Life Insurance Co. N/A 50 51
Other (2) 125 123
Total $ 4,400 $ 4,143
(1) The reinsurance recoverable on paid and unpaid benefits related to the Scottish Re Group as of December 31, 2010
comprised $73 million related to Scottish Re Life Corporation and $63 million related to Scottish Re (U.S.), Inc. The
reinsurance recoverable on paid and unpaid benefits related to the Scottish Re Group as of December 31, 2009
comprised $74 million related to Scottish Re Life Corporation and $63 million related to Scottish Re (U.S.), Inc.
(2) As of December 31, 2010 and 2009, the other category includes $106 million and $100 million, respectively, of
recoverables due from reinsurers with an investment grade credit rating from Standard & Poor’s (‘‘S&P’’).
(3) N/A reflects no rating available.
Certain of our reinsurers experienced rating downgrades in 2010 by S&P, including Security Life of Denver and
Manulife Insurance Company. We continuously monitor the creditworthiness of reinsurers in order to determine our risk
63
MD&A