Allstate 2011 Annual Report Download - page 126
Download and view the complete annual report
Please find page 126 of the 2011 Allstate annual report below. You can navigate through the pages in the report by either clicking on the pages listed below, or by using the keyword search tool below to find specific information within the annual report.-
 1
1 -
2
-
3
-
4
-
5
-
6
-
7
-
8
-
9
-
10
-
11
-
12
-
13
-
14
-
15
-
16
-
17
-
18
-
19
-
20
-
21
-
22
-
23
-
24
-
25
-
26
-
27
-
28
-
29
-
30
-
31
-
32
-
33
-
34
-
35
-
36
-
37
-
38
-
39
-
40
-
41
-
42
-
43
-
44
-
45
-
46
-
47
-
48
-
49
-
50
-
51
-
52
-
53
-
54
-
55
-
56
-
57
-
58
-
59
-
60
-
61
-
62
-
63
-
64
-
65
-
66
-
67
-
68
-
69
-
70
-
71
-
72
-
73
-
74
-
75
-
76
-
77
-
78
-
79
-
80
-
81
-
82
-
83
-
84
-
85
-
86
-
87
-
88
-
89
-
90
-
91
-
92
-
93
-
94
-
95
-
96
-
97
-
98
-
99
-
100
-
101
-
102
-
103
-
104
-
105
-
106
-
107
-
108
-
109
-
110
-
111
-
112
-
113
-
114
-
115
-
 116
116 -
 117
117 -
 118
118 -
 119
119 -
 120
120 -
 121
121 -
 122
122 -
 123
123 -
 124
124 -
 125
125 -
 126
126 -
 127
127 -
 128
128 -
 129
129 -
 130
130 -
 131
131 -
 132
132 -
 133
133 -
 134
134 -
 135
135 -
 136
136 -
137
-
138
-
139
-
140
-
141
-
142
-
143
-
144
-
145
-
146
-
147
-
148
-
149
-
150
-
151
-
152
-
153
-
154
-
155
-
156
-
157
-
158
-
159
-
160
-
161
-
162
-
163
-
164
-
165
-
166
-
167
-
168
-
169
-
170
-
171
-
172
-
173
-
174
-
175
-
176
-
177
-
178
-
179
-
180
-
181
-
182
-
183
-
184
-
185
-
186
-
187
-
188
-
189
-
190
-
191
-
192
-
193
-
194
-
195
-
196
-
197
-
198
-
199
-
200
-
201
-
202
-
203
-
204
-
205
-
206
-
207
-
208
-
209
-
210
-
211
-
212
-
213
-
214
-
215
-
216
-
217
-
218
-
219
-
220
-
221
-
222
-
223
-
224
-
225
-
226
-
227
-
228
-
229
-
230
-
231
-
232
-
233
-
234
-
235
-
236
-
237
-
238
-
239
-
240
-
241
-
242
-
243
-
244
-
245
-
246
-
247
-
248
-
249
-
250
-
251
-
252
-
253
-
254
-
255
-
256
-
257
-
258
-
259
-
260
-
261
-
262
-
263
-
264
-
265
-
266
-
267
-
268
-
269
-
270
-
271
-
272
-
273
-
274
-
275
-
276
 |
 |

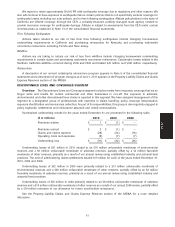
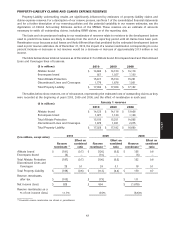
2008 Prior year reserve reestimates
($ in millions) 1998 &
prior 1999 2000 2001 2002 2003 2004 2005 2006 2007 Total
Allstate brand $ 56 $ (7) $ 9 $ 34 $ 1 $ (5) $ 13 $ 152 $ (71) $ (27) $ 155
Encompass brand 2 — 2 (1) 2 1 (1) 10 (20) 2 (3)
Total Allstate Protection 58 (7) 11 33 3 (4) 12 162 (91) (25) 152
Discontinued Lines and
Coverages 18 —————————18
Total Property-Liability $ 76 $ (7) $ 11 $ 33 $ 3 $ (4) $ 12 $ 162 $ (91) $ (25) $ 170
Allstate brand prior year reserve reestimates were $181 million favorable in 2010, $126 million favorable in 2009 and
$155 million unfavorable in 2008, respectively. In 2010, this was primarily due to favorable catastrophe reserve
reestimates and severity development that was better than expected, partially offset by litigation settlements. The
increased reserves in accident years 2000 & prior is due to the litigation settlements of $100 million, a reclassification of
injury reserves to older years and reserve strengthening. In 2009, this was primarily due to favorable reserve reestimates
from Hurricanes Ike and Gustav and a catastrophe related subrogation recovery. The shift of reserves to older accident
years is attributable to a reallocation of reserves related to employee postretirement benefits to more accident years,
and a reclassification of injury and 2008 non-injury reserves to older years. In 2008, this was primarily due to litigation
filed in conjunction with a Louisiana deadline for filing suits related to Hurricane Katrina.
These trends are primarily responsible for revisions to loss development factors, as previously described, used to
predict how losses are likely to develop from the end of a reporting period until all claims have been paid. Because these
trends cause actual losses to differ from those predicted by the estimated development factors used in prior reserve
estimates, reserves are revised as actuarial studies validate new trends based on the indications of updated
development factor calculations.
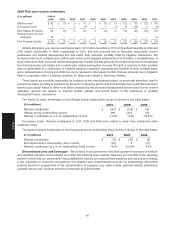
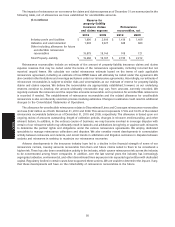
The impact of these reestimates on the Allstate brand underwriting income is shown in the table below.
($ in millions) 2010 2009 2008
Reserve reestimates $ (181) $ (126) $ 155
Allstate brand underwriting income 569 1,022 220
Reserve reestimates as a % of underwriting income 31.8% 12.3% (70.5)%
Encompass brand Reserve reestimates in 2010, 2009 and 2008 were related to lower than anticipated claim
settlement costs.
The impact of these reestimates on the Encompass brand underwriting (loss) income is shown in the table below.
($ in millions) 2010 2009 2008
Reserve reestimates $ (6) $ (10) $ (3)
Encompass brand underwriting (loss) income (43) 5 (31)
Reserve reestimates as a % of underwriting (loss) income 14.0% 200.0% 9.7%
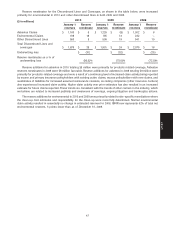
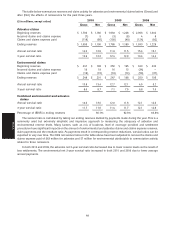
Discontinued Lines and Coverages We conduct an annual review in the third quarter of each year to evaluate
and establish asbestos, environmental and other discontinued lines reserves. Reserves are recorded in the reporting
period in which they are determined. Using established industry and actuarial best practices and assuming no change
in the regulatory or economic environment, this detailed and comprehensive grounds up methodology determines
reserves based on assessments of the characteristics of exposure (e.g. claim activity, potential liability, jurisdiction,
products versus non-products exposure) presented by policyholders.
46
MD&A