Allstate 2011 Annual Report Download - page 222
Download and view the complete annual report
Please find page 222 of the 2011 Allstate annual report below. You can navigate through the pages in the report by either clicking on the pages listed below, or by using the keyword search tool below to find specific information within the annual report.-
 1
1 -
2
-
3
-
4
-
5
-
6
-
7
-
8
-
9
-
10
-
11
-
12
-
13
-
14
-
15
-
16
-
17
-
18
-
19
-
20
-
21
-
22
-
23
-
24
-
25
-
26
-
27
-
28
-
29
-
30
-
31
-
32
-
33
-
34
-
35
-
36
-
37
-
38
-
39
-
40
-
41
-
42
-
43
-
44
-
45
-
46
-
47
-
48
-
49
-
50
-
51
-
52
-
53
-
54
-
55
-
56
-
57
-
58
-
59
-
60
-
61
-
62
-
63
-
64
-
65
-
66
-
67
-
68
-
69
-
70
-
71
-
72
-
73
-
74
-
75
-
76
-
77
-
78
-
79
-
80
-
81
-
82
-
83
-
84
-
85
-
86
-
87
-
88
-
89
-
90
-
91
-
92
-
93
-
94
-
95
-
96
-
97
-
98
-
99
-
100
-
101
-
102
-
103
-
104
-
105
-
106
-
107
-
108
-
109
-
110
-
111
-
112
-
113
-
114
-
115
-
116
-
117
-
118
-
119
-
120
-
121
-
122
-
123
-
124
-
125
-
126
-
127
-
128
-
129
-
130
-
131
-
132
-
133
-
134
-
135
-
136
-
137
-
138
-
139
-
140
-
141
-
142
-
143
-
144
-
145
-
146
-
147
-
148
-
149
-
150
-
151
-
152
-
153
-
154
-
155
-
156
-
157
-
158
-
159
-
160
-
161
-
162
-
163
-
164
-
165
-
166
-
167
-
168
-
169
-
170
-
171
-
172
-
173
-
174
-
175
-
176
-
177
-
178
-
179
-
180
-
181
-
182
-
183
-
184
-
185
-
186
-
187
-
188
-
189
-
190
-
191
-
192
-
193
-
194
-
195
-
196
-
197
-
198
-
199
-
200
-
201
-
202
-
203
-
204
-
205
-
206
-
207
-
208
-
209
-
210
-
211
-
 212
212 -
 213
213 -
 214
214 -
 215
215 -
 216
216 -
 217
217 -
 218
218 -
 219
219 -
 220
220 -
 221
221 -
 222
222 -
 223
223 -
 224
224 -
 225
225 -
 226
226 -
 227
227 -
 228
228 -
 229
229 -
 230
230 -
 231
231 -
 232
232 -
233
-
234
-
235
-
236
-
237
-
238
-
239
-
240
-
241
-
242
-
243
-
244
-
245
-
246
-
247
-
248
-
249
-
250
-
251
-
252
-
253
-
254
-
255
-
256
-
257
-
258
-
259
-
260
-
261
-
262
-
263
-
264
-
265
-
266
-
267
-
268
-
269
-
270
-
271
-
272
-
273
-
274
-
275
-
276
 |
 |

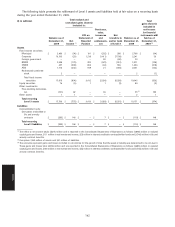
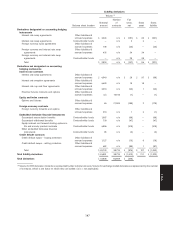
The following table presents the rollforward of Level 3 assets and liabilities held at fair value on a recurring basis
during the year ended December 31, 2009.
Total realized and Total($ in millions) unrealized gains (losses) gains (losses)
included in: included in
Purchases, net income
sales, for financial
OCI on issuances Net instruments still
Balance as of Statement of and transfers in Balance as of held as of
December 31, Net Financial settlements, and/or (out) December 31, December 31,
2008 income (1) Position net of Level 3 2009 2009 (3)
Assets
Fixed income securities:
Municipal $ 2,463 $ (34) $ 191 $ (202) $ 288 $ 2,706 $ (34)
Corporate 10,195 (20) 1,216 (1,411) (7,739) 2,241 53
Foreign government — — — 80 (60) 20 —
RMBS 2,988 (179) 283 (470) (951) 1,671 (128)
CMBS 457 (399) 804 (42) 584 1,404 (318)
ABS 1,714 (202) 918 21 (450) 2,001 (122)
Redeemable preferred
stock 2 — — — — 2 (1)
Total fixed income
securities 17,819 (834) 3,412 (2,024) (8,328) 10,045 (550)
Equity securities 74 (4) 1 1 (3) 69 (5)
Other investments:
Free-standing derivatives,
net (101) 62 — 94 — 55 (2) 180
Other assets 1 1 — — — 2 1
Total recurring
Level 3 assets $ 17,793 $ (775) $ 3,413 $ (1,929) $ (8,331) $ 10,171 $ (374)
Liabilities
Contractholder funds:
Derivatives embedded in
life and annuity
contracts $ (265) $ 148 $ — $ 7 $ — $ (110) $ 148
Total recurring
Level 3 liabilities $ (265) $ 148 $ — $ 7 $ — $ (110) $ 148
(1) The effect to net income totals $(627) million and is reported in the Consolidated Statements of Operations as follows: $(889) million in realized
capital gains and losses, $111 million in net investment income, $(3) million in interest credited to contractholder funds and $(148) million in life and
annuity contract benefits.
(2) Comprises $146 million of assets and $91 million of liabilities.
(3) The amounts represent gains and losses included in net income for the period of time that the asset or liability was determined to be in Level 3.
These gains and losses total $(226) million and are reported in the Consolidated Statements of Operations as follows: $(486) million in realized
capital gains and losses, $106 million in net investment income, $(6) million in interest credited to contractholder funds and $(148) million in life and
annuity contract benefits.
142
Notes