Allstate 2011 Annual Report Download - page 153
Download and view the complete annual report
Please find page 153 of the 2011 Allstate annual report below. You can navigate through the pages in the report by either clicking on the pages listed below, or by using the keyword search tool below to find specific information within the annual report.-
 1
1 -
2
-
3
-
4
-
5
-
6
-
7
-
8
-
9
-
10
-
11
-
12
-
13
-
14
-
15
-
16
-
17
-
18
-
19
-
20
-
21
-
22
-
23
-
24
-
25
-
26
-
27
-
28
-
29
-
30
-
31
-
32
-
33
-
34
-
35
-
36
-
37
-
38
-
39
-
40
-
41
-
42
-
43
-
44
-
45
-
46
-
47
-
48
-
49
-
50
-
51
-
52
-
53
-
54
-
55
-
56
-
57
-
58
-
59
-
60
-
61
-
62
-
63
-
64
-
65
-
66
-
67
-
68
-
69
-
70
-
71
-
72
-
73
-
74
-
75
-
76
-
77
-
78
-
79
-
80
-
81
-
82
-
83
-
84
-
85
-
86
-
87
-
88
-
89
-
90
-
91
-
92
-
93
-
94
-
95
-
96
-
97
-
98
-
99
-
100
-
101
-
102
-
103
-
104
-
105
-
106
-
107
-
108
-
109
-
110
-
111
-
112
-
113
-
114
-
115
-
116
-
117
-
118
-
119
-
120
-
121
-
122
-
123
-
124
-
125
-
126
-
127
-
128
-
129
-
130
-
131
-
132
-
133
-
134
-
135
-
136
-
137
-
138
-
139
-
140
-
141
-
142
-
 143
143 -
 144
144 -
 145
145 -
 146
146 -
 147
147 -
 148
148 -
 149
149 -
 150
150 -
 151
151 -
 152
152 -
 153
153 -
 154
154 -
 155
155 -
 156
156 -
 157
157 -
 158
158 -
 159
159 -
 160
160 -
 161
161 -
 162
162 -
 163
163 -
164
-
165
-
166
-
167
-
168
-
169
-
170
-
171
-
172
-
173
-
174
-
175
-
176
-
177
-
178
-
179
-
180
-
181
-
182
-
183
-
184
-
185
-
186
-
187
-
188
-
189
-
190
-
191
-
192
-
193
-
194
-
195
-
196
-
197
-
198
-
199
-
200
-
201
-
202
-
203
-
204
-
205
-
206
-
207
-
208
-
209
-
210
-
211
-
212
-
213
-
214
-
215
-
216
-
217
-
218
-
219
-
220
-
221
-
222
-
223
-
224
-
225
-
226
-
227
-
228
-
229
-
230
-
231
-
232
-
233
-
234
-
235
-
236
-
237
-
238
-
239
-
240
-
241
-
242
-
243
-
244
-
245
-
246
-
247
-
248
-
249
-
250
-
251
-
252
-
253
-
254
-
255
-
256
-
257
-
258
-
259
-
260
-
261
-
262
-
263
-
264
-
265
-
266
-
267
-
268
-
269
-
270
-
271
-
272
-
273
-
274
-
275
-
276
 |
 |

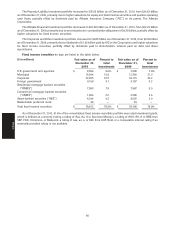
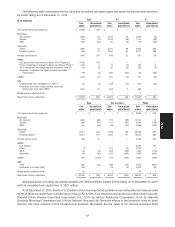
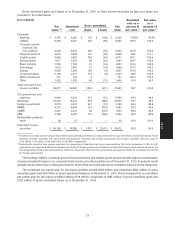
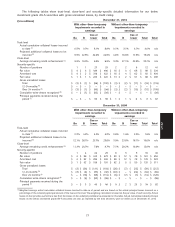
Gross unrealized gains and losses as of December 31, 2010 on fixed income securities by type and sector are
provided in the table below.
($ in millions) Amortized Fair value
cost as a as a
Gross unrealized
Par Amortized Fair percent of percent of
value (1) cost Gains Losses value par value (2) par value (2)
Corporate:
Banking $ 4,378 $ 4,282 $ 118 $ (154) $ 4,246 97.8% 97.0%
Utilities 6,209 6,227 433 (58) 6,602 100.3 106.3
Consumer goods
(cyclical and
non-cyclical) 6,236 6,318 305 (53) 6,570 101.3 105.4
Financial services 3,619 3,553 141 (36) 3,658 98.2 101.1
Capital goods 3,862 3,867 238 (34) 4,071 100.1 105.4
Transportation 1,911 1,925 99 (29) 1,995 100.7 104.4
Basic industry 1,726 1,750 91 (14) 1,827 101.4 105.9
Technology 1,613 1,641 72 (14) 1,699 101.7 105.3
Energy 2,455 2,480 136 (9) 2,607 101.0 106.2
Communications 2,139 2,117 115 (9) 2,223 99.0 103.9
FDIC guaranteed 721 724 3 — 727 100.4 100.8
Other 1,502 1,376 65 (11) 1,430 91.6 95.2
Total corporate fixed
income portfolio 36,371 36,260 1,816 (421) 37,655 99.7 103.5
U.S. government and
agencies 8,904 8,320 327 (51) 8,596 93.4 96.5
Municipal 20,323 16,201 379 (646) 15,934 79.7 78.4
Foreign government 3,270 2,821 347 (10) 3,158 86.3 96.6
RMBS 9,231 8,509 216 (732) 7,993 92.2 86.6
CMBS 2,227 2,213 58 (277) 1,994 99.4 89.5
ABS 4,796 4,425 113 (294) 4,244 92.3 88.5
Redeemable preferred
stock 38 37 1 — 38 97.4 100.0
Total fixed income
securities $ 85,160 $ 78,786 $ 3,257 $ (2,431) $ 79,612 92.5 93.5
(1) Included in par value are zero-coupon securities that are generally purchased at a deep discount to the par value that is received at maturity. These
primarily included corporate, U.S. government and agencies, municipal and foreign government zero-coupon securities with par value of
$723 million, $1.70 billion, $5.82 billion and $1.36 billion, respectively.
(2) Excluding the impact of zero-coupon securities, the percentage of amortized cost to par value would be 100.1% for corporates, 101.8% for U.S.
government and agencies, 99.6% for municipals and 103.7% for foreign governments. Similarly, excluding the impact of zero-coupon securities, the
percentage of fair value to par value would be 103.9% for corporates, 103.2% for U.S. government and agencies, 98.8% for municipals and 109.7%
for foreign governments.
The banking, utilities, consumer goods, financial services and capital goods sectors had the highest concentration
of gross unrealized losses in our corporate fixed income securities portfolio as of December 31, 2010. In general, credit
spreads remain wider than at initial purchase for most of the securities with gross unrealized losses in these categories.
The unrealized net capital gain for the equity portfolio totaled $583 million and comprised $646 million of gross
unrealized gains and $63 million of gross unrealized losses as of December 31, 2010. This is compared to an unrealized
net capital gain for the equity portfolio totaling $179 million, comprised of $381 million of gross unrealized gains and
$202 million of gross unrealized losses as of December 31, 2009.
73
MD&A