Allstate 2011 Annual Report Download - page 175
Download and view the complete annual report
Please find page 175 of the 2011 Allstate annual report below. You can navigate through the pages in the report by either clicking on the pages listed below, or by using the keyword search tool below to find specific information within the annual report.-
 1
1 -
2
-
3
-
4
-
5
-
6
-
7
-
8
-
9
-
10
-
11
-
12
-
13
-
14
-
15
-
16
-
17
-
18
-
19
-
20
-
21
-
22
-
23
-
24
-
25
-
26
-
27
-
28
-
29
-
30
-
31
-
32
-
33
-
34
-
35
-
36
-
37
-
38
-
39
-
40
-
41
-
42
-
43
-
44
-
45
-
46
-
47
-
48
-
49
-
50
-
51
-
52
-
53
-
54
-
55
-
56
-
57
-
58
-
59
-
60
-
61
-
62
-
63
-
64
-
65
-
66
-
67
-
68
-
69
-
70
-
71
-
72
-
73
-
74
-
75
-
76
-
77
-
78
-
79
-
80
-
81
-
82
-
83
-
84
-
85
-
86
-
87
-
88
-
89
-
90
-
91
-
92
-
93
-
94
-
95
-
96
-
97
-
98
-
99
-
100
-
101
-
102
-
103
-
104
-
105
-
106
-
107
-
108
-
109
-
110
-
111
-
112
-
113
-
114
-
115
-
116
-
117
-
118
-
119
-
120
-
121
-
122
-
123
-
124
-
125
-
126
-
127
-
128
-
129
-
130
-
131
-
132
-
133
-
134
-
135
-
136
-
137
-
138
-
139
-
140
-
141
-
142
-
143
-
144
-
145
-
146
-
147
-
148
-
149
-
150
-
151
-
152
-
153
-
154
-
155
-
156
-
157
-
158
-
159
-
160
-
161
-
162
-
163
-
164
-
 165
165 -
 166
166 -
 167
167 -
 168
168 -
 169
169 -
 170
170 -
 171
171 -
 172
172 -
 173
173 -
 174
174 -
 175
175 -
 176
176 -
 177
177 -
 178
178 -
 179
179 -
 180
180 -
 181
181 -
 182
182 -
 183
183 -
 184
184 -
 185
185 -
186
-
187
-
188
-
189
-
190
-
191
-
192
-
193
-
194
-
195
-
196
-
197
-
198
-
199
-
200
-
201
-
202
-
203
-
204
-
205
-
206
-
207
-
208
-
209
-
210
-
211
-
212
-
213
-
214
-
215
-
216
-
217
-
218
-
219
-
220
-
221
-
222
-
223
-
224
-
225
-
226
-
227
-
228
-
229
-
230
-
231
-
232
-
233
-
234
-
235
-
236
-
237
-
238
-
239
-
240
-
241
-
242
-
243
-
244
-
245
-
246
-
247
-
248
-
249
-
250
-
251
-
252
-
253
-
254
-
255
-
256
-
257
-
258
-
259
-
260
-
261
-
262
-
263
-
264
-
265
-
266
-
267
-
268
-
269
-
270
-
271
-
272
-
273
-
274
-
275
-
276
 |
 |

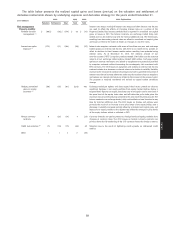
negative duration gap, as the duration of its assets and liabilities vary with its product mix and investing activity. As of
December 31, 2010, Property-Liability had a positive duration gap while Allstate Financial had a negative duration gap.
In the management of investments supporting the Property-Liability business, we adhere to an objective of
emphasizing safety of principal and consistency of income within a total return framework. This approach is designed to
ensure our financial strength and stability for paying claims, while maximizing economic value and surplus growth.
For the Allstate Financial business, we seek to invest premiums, contract charges and deposits to generate future
cash flows that will fund future claims, benefits and expenses, and that will earn stable spreads across a wide variety of
interest rate and economic scenarios. To achieve this objective and limit interest rate risk for Allstate Financial, we
adhere to a philosophy of managing the duration of assets and related liabilities within predetermined tolerance levels.
This philosophy is executed using duration targets for fixed income investments in addition to interest rate swaps,
futures, forwards, caps, floors and swaptions to reduce the interest rate risk resulting from mismatches between
existing assets and liabilities, and financial futures and other derivative instruments to hedge the interest rate risk of
anticipated purchases and sales of investments and product sales to customers.
We pledge and receive collateral on certain types of derivative contracts. For futures and option contracts traded on
exchanges, we have pledged securities and cash as margin deposits totaling $37 million as of December 31, 2010. For
OTC derivative transactions including interest rate swaps, foreign currency swaps, interest rate caps, interest rate floors,
CDS, forwards and certain options (including swaptions), master netting agreements are used. These agreements allow
us to net payments due for transactions covered by the agreements and, when applicable, we are required to post
collateral. As of December 31, 2010, we held $58 million of cash and securities pledged by counterparties as collateral
for OTC instruments, and we pledged $193 million of cash and securities as collateral to counterparties.
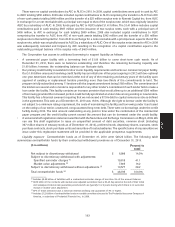
We performed a sensitivity analysis on OTC derivative collateral by assuming a hypothetical 100 basis point decline
in interest rates. The analysis indicated that we would have to post an estimated $194 million in additional collateral with
55% attributable to Allstate Financial. The selection of these hypothetical scenarios should not be construed as our
prediction of future events, but only as an illustration of the estimated potential effect of such events. We also actively
manage our counterparty credit risk exposure by monitoring the level of collateral posted by our counterparties with
respect to our receivable positions.
To calculate the duration gap between assets and liabilities, we project asset and liability cash flows and calculate
their net present value using a risk-free market interest rate adjusted for credit quality, sector attributes, liquidity and
other specific risks. Duration is calculated by revaluing these cash flows at alternative interest rates and determining the
percentage change in aggregate fair value. The cash flows used in this calculation include the expected maturity and
repricing characteristics of our derivative financial instruments, all other financial instruments, and certain other items
including unearned premiums, property-liability insurance claims and claims expense reserves, annuity liabilities and
other interest-sensitive liabilities. The projections include assumptions (based upon historical market experience and
our experience) that reflect the effect of changing interest rates on the prepayment, lapse, leverage and/or option
features of instruments, where applicable. The preceding assumptions relate primarily to mortgage-backed securities,
municipal housing bonds, callable municipal and corporate obligations, and fixed rate single and flexible premium
deferred annuities. Additionally, the calculations include assumptions regarding the renewal of property-liability
policies.
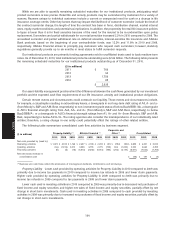
Based upon the information and assumptions used in the duration calculation, and interest rates in effect as of
December 31, 2010, we estimate that a 100 basis point immediate, parallel increase in interest rates (‘‘rate shock’’)
would decrease the net fair value of the assets and liabilities by $1 million, compared to $378 million as of December 31,
2009, reflecting year to year changes in duration. Reflected in the duration calculation are the effects of a program that
uses swaps, eurodollar futures, options on Treasury futures and interest rate swaptions to manage interest rate risk. In
calculating the impact of a 100 basis point increase on the value of the derivatives, we have assumed interest rate
volatility remains constant. Based on the swaps, eurodollar futures, options on Treasury futures and interest rate
swaptions in place as of December 31, 2010, we would recognize realized capital gains totaling $327 million in the event
of a 100 basis point immediate, parallel interest rate increase and $126 million in realized capital losses in the event of a
100 basis point immediate, parallel interest rate decrease on these derivatives. The selection of a 100 basis point
immediate parallel change in interest rates should not be construed as our prediction of future market events, but only
as an illustration of the potential effect of such an event. There are $8.71 billion of assets supporting life insurance
products such as traditional and interest-sensitive life that are not financial instruments. These assets and the
associated liabilities have not been included in the above estimate. The $8.71 billion of assets excluded from the
calculation has increased from $8.12 billion as of December 31, 2009, due to an increase in interest-sensitive life
contractholder funds and improved fixed income valuations as a result of declining risk-free interest rates and
95
MD&A