Allstate 2011 Annual Report Download - page 136
Download and view the complete annual report
Please find page 136 of the 2011 Allstate annual report below. You can navigate through the pages in the report by either clicking on the pages listed below, or by using the keyword search tool below to find specific information within the annual report.-
 1
1 -
2
-
3
-
4
-
5
-
6
-
7
-
8
-
9
-
10
-
11
-
12
-
13
-
14
-
15
-
16
-
17
-
18
-
19
-
20
-
21
-
22
-
23
-
24
-
25
-
26
-
27
-
28
-
29
-
30
-
31
-
32
-
33
-
34
-
35
-
36
-
37
-
38
-
39
-
40
-
41
-
42
-
43
-
44
-
45
-
46
-
47
-
48
-
49
-
50
-
51
-
52
-
53
-
54
-
55
-
56
-
57
-
58
-
59
-
60
-
61
-
62
-
63
-
64
-
65
-
66
-
67
-
68
-
69
-
70
-
71
-
72
-
73
-
74
-
75
-
76
-
77
-
78
-
79
-
80
-
81
-
82
-
83
-
84
-
85
-
86
-
87
-
88
-
89
-
90
-
91
-
92
-
93
-
94
-
95
-
96
-
97
-
98
-
99
-
100
-
101
-
102
-
103
-
104
-
105
-
106
-
107
-
108
-
109
-
110
-
111
-
112
-
113
-
114
-
115
-
116
-
117
-
118
-
119
-
120
-
121
-
122
-
123
-
124
-
125
-
 126
126 -
 127
127 -
 128
128 -
 129
129 -
 130
130 -
 131
131 -
 132
132 -
 133
133 -
 134
134 -
 135
135 -
 136
136 -
 137
137 -
 138
138 -
 139
139 -
 140
140 -
 141
141 -
 142
142 -
 143
143 -
 144
144 -
 145
145 -
 146
146 -
147
-
148
-
149
-
150
-
151
-
152
-
153
-
154
-
155
-
156
-
157
-
158
-
159
-
160
-
161
-
162
-
163
-
164
-
165
-
166
-
167
-
168
-
169
-
170
-
171
-
172
-
173
-
174
-
175
-
176
-
177
-
178
-
179
-
180
-
181
-
182
-
183
-
184
-
185
-
186
-
187
-
188
-
189
-
190
-
191
-
192
-
193
-
194
-
195
-
196
-
197
-
198
-
199
-
200
-
201
-
202
-
203
-
204
-
205
-
206
-
207
-
208
-
209
-
210
-
211
-
212
-
213
-
214
-
215
-
216
-
217
-
218
-
219
-
220
-
221
-
222
-
223
-
224
-
225
-
226
-
227
-
228
-
229
-
230
-
231
-
232
-
233
-
234
-
235
-
236
-
237
-
238
-
239
-
240
-
241
-
242
-
243
-
244
-
245
-
246
-
247
-
248
-
249
-
250
-
251
-
252
-
253
-
254
-
255
-
256
-
257
-
258
-
259
-
260
-
261
-
262
-
263
-
264
-
265
-
266
-
267
-
268
-
269
-
270
-
271
-
272
-
273
-
274
-
275
-
276
 |
 |

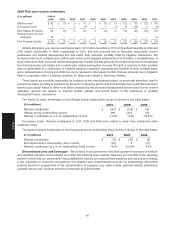
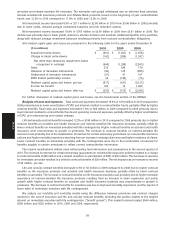
Analysis of revenues Total revenues decreased 1.9% or $87 million in 2010 compared to 2009 due to lower net
investment income and higher net realized capital losses, partially offset by higher premiums and contract charges.
Total revenues increased 78.0% or $2.01 billion in 2009 compared to 2008 primarily due to a $2.70 billion decrease in net
realized capital losses, partially offset by a $747 million decline in net investment income.
Life and annuity premiums and contract charges Premiums represent revenues generated from traditional life
insurance, immediate annuities with life contingencies, and accident and health insurance products that have
significant mortality or morbidity risk. Contract charges are revenues generated from interest-sensitive and variable life
insurance and fixed annuities for which deposits are classified as contractholder funds or separate account liabilities.
Contract charges are assessed against the contractholder account values for maintenance, administration, cost of
insurance and surrender prior to contractually specified dates.
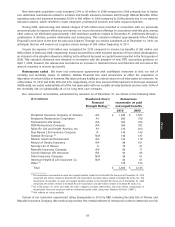
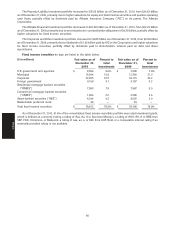
The following table summarizes life and annuity premiums and contract charges by product for the years ended
December 31.
($ in millions) 2010 2009 2008
Underwritten products
Traditional life insurance premiums $ 420 $ 407 $ 399
Accident and health insurance premiums 621 460 412
Interest-sensitive life insurance contract charges 991 944 896
Subtotal 2,032 1,811 1,707
Annuities
Immediate annuities with life contingencies premiums 97 102 132
Other fixed annuity contract charges 39 45 56
Subtotal 136 147 188
Life and annuity premiums and contract charges (1) $ 2,168 $ 1,958 $ 1,895
(1) Total contract charges include contract charges related to the cost of insurance totaling $637 million, $616 million and
$595 million in 2010, 2009 and 2008, respectively.
Total premiums and contract charges increased 10.7% in 2010 compared to 2009 primarily due to higher sales of
accident and health insurance through Allstate Benefits, with a significant portion of the increase resulting from sales to
employees of one large company, and higher contract charges on interest-sensitive life insurance products resulting
from a shift in the mix of policies in force to contracts with higher cost of insurance rates and policy administration fees.
In addition, increased traditional life insurance premiums in 2010 were primarily due to lower reinsurance premiums
resulting from higher retention, partially offset by lower renewal premiums and decreased sales.
Total premiums and contract charges increased 3.3% in 2009 compared to 2008 due to higher sales of accident and
health insurance through Allstate Benefits and higher contract charges on interest-sensitive life insurance products
resulting from increases in certain policy administration fees, partially offset by lower sales of immediate annuities with
life contingencies.
Contractholder funds represent interest-bearing liabilities arising from the sale of individual and institutional
products, such as interest-sensitive life insurance, fixed annuities, funding agreements and bank deposits. The balance
of contractholder funds is equal to the cumulative deposits received and interest credited to the contractholder less
56
MD&A