Allstate 2011 Annual Report Download - page 161
Download and view the complete annual report
Please find page 161 of the 2011 Allstate annual report below. You can navigate through the pages in the report by either clicking on the pages listed below, or by using the keyword search tool below to find specific information within the annual report.-
 1
1 -
2
-
3
-
4
-
5
-
6
-
7
-
8
-
9
-
10
-
11
-
12
-
13
-
14
-
15
-
16
-
17
-
18
-
19
-
20
-
21
-
22
-
23
-
24
-
25
-
26
-
27
-
28
-
29
-
30
-
31
-
32
-
33
-
34
-
35
-
36
-
37
-
38
-
39
-
40
-
41
-
42
-
43
-
44
-
45
-
46
-
47
-
48
-
49
-
50
-
51
-
52
-
53
-
54
-
55
-
56
-
57
-
58
-
59
-
60
-
61
-
62
-
63
-
64
-
65
-
66
-
67
-
68
-
69
-
70
-
71
-
72
-
73
-
74
-
75
-
76
-
77
-
78
-
79
-
80
-
81
-
82
-
83
-
84
-
85
-
86
-
87
-
88
-
89
-
90
-
91
-
92
-
93
-
94
-
95
-
96
-
97
-
98
-
99
-
100
-
101
-
102
-
103
-
104
-
105
-
106
-
107
-
108
-
109
-
110
-
111
-
112
-
113
-
114
-
115
-
116
-
117
-
118
-
119
-
120
-
121
-
122
-
123
-
124
-
125
-
126
-
127
-
128
-
129
-
130
-
131
-
132
-
133
-
134
-
135
-
136
-
137
-
138
-
139
-
140
-
141
-
142
-
143
-
144
-
145
-
146
-
147
-
148
-
149
-
150
-
 151
151 -
 152
152 -
 153
153 -
 154
154 -
 155
155 -
 156
156 -
 157
157 -
 158
158 -
 159
159 -
 160
160 -
 161
161 -
 162
162 -
 163
163 -
 164
164 -
 165
165 -
 166
166 -
 167
167 -
 168
168 -
 169
169 -
 170
170 -
 171
171 -
172
-
173
-
174
-
175
-
176
-
177
-
178
-
179
-
180
-
181
-
182
-
183
-
184
-
185
-
186
-
187
-
188
-
189
-
190
-
191
-
192
-
193
-
194
-
195
-
196
-
197
-
198
-
199
-
200
-
201
-
202
-
203
-
204
-
205
-
206
-
207
-
208
-
209
-
210
-
211
-
212
-
213
-
214
-
215
-
216
-
217
-
218
-
219
-
220
-
221
-
222
-
223
-
224
-
225
-
226
-
227
-
228
-
229
-
230
-
231
-
232
-
233
-
234
-
235
-
236
-
237
-
238
-
239
-
240
-
241
-
242
-
243
-
244
-
245
-
246
-
247
-
248
-
249
-
250
-
251
-
252
-
253
-
254
-
255
-
256
-
257
-
258
-
259
-
260
-
261
-
262
-
263
-
264
-
265
-
266
-
267
-
268
-
269
-
270
-
271
-
272
-
273
-
274
-
275
-
276
 |
 |

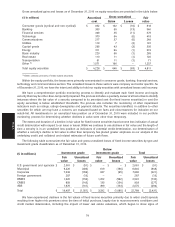
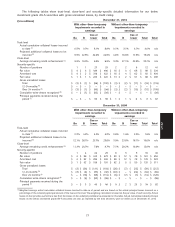
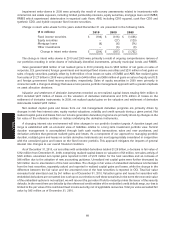
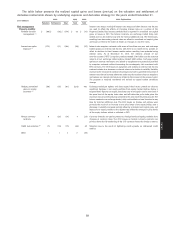
The following table shows actual trust-level key metrics specific to the trusts from which our below investment
grade Subprime securities with gross unrealized losses were issued, as reported by the trust servicers.
December 31, September 30, June 30, March 31, December 31,
2010 2010 2010 2010 2009
Trust-level statistics
Delinquency rates 28.8% 28.6% 29.3% 31.7% 30.9%
Actual cumulative collateral
losses incurred to date 16.5% 15.4% 14.7% 14.4% 13.5%
We believe the unrealized losses on our Subprime securities, including those over 24 months, result from the
current risk premium on these securities, which should continue to reverse over the securities’ remaining lives, as
demonstrated by improved valuations in 2010. We expect to receive our estimated share of contractual principal and
interest collections used to determine the securities’ recovery value. As of December 31, 2010, we do not have the intent
to sell and it is not more likely than not we will be required to sell these securities before the recovery of their amortized
cost basis. We believe that our valuation and impairment processes are comprehensive, employ the most current views
about collateral and securitization trust financial positions, and demonstrate our recorded impairments and that the
remaining unrealized losses on these positions are temporary.
Other-than-temporary impairment assessment for below investment grade CMBS
As of December 31, 2010, the fair value of our below investment grade CMBS with gross unrealized losses totaled
$135 million compared to $67 million as of December 31, 2009. As of December 31, 2010, gross unrealized losses for our
below investment grade CMBS portfolio totaled $134 million, an increase of 9.8% compared to $122 million as of
December 31, 2009. The increase over prior year was primarily due to downgrades of certain CMBS to below investment
grade during 2010, partially offset by improved valuations and sales during 2010 in anticipation of negative capital
treatment by certain regulatory and rating agencies. There were no gross unrealized gains for this portfolio as of
December 31, 2010.
The credit loss evaluation for CMBS with gross unrealized losses is performed in two phases. The first phase
estimates the future cash flows of the entire securitization trust from which our security was issued. A critical part of this
estimate involves forecasting the collateral losses of the commercial mortgage loans that collateralize the securitization
trust. Factors affecting these estimates include, but are not limited to, estimates of current and future commercial
property prices, current and projected rental incomes, the propensity of the mortgage loans to default under these
assumptions and loss severities in cases of default. Estimates of future property prices and rental incomes consider
specific property-type and geographic economic trends such as employment, property vacancy and rental rates, and
forecasts of new supply in the commercial real estate markets. Estimates of default rates and loss severities consider
factors such as borrower payment history, the origination practices of the transaction sponsor, overall collateral quality
and diversification, transaction vintage year, maturity date, overall transaction structure and other factors that may
influence performance. Realized losses in the CMBS market have historically been low and, we believe, are not
predictive of future losses. Therefore, our projections of collateral performance rely on probability-weighted scenarios
informed by credit opinions obtained from third parties, such as nationally recognized credit rating agencies, industry
analysts and CMBS loss modeling advisory services.
We then analyze the actual cumulative collateral losses incurred to date by the securitization trust, our projected
additional collateral losses expected to be incurred and the position of the class of securities we own in the
securitization trust relative to the trust’s other classes to determine whether any of the collateral losses will be applied to
our class. If our class has remaining credit enhancement sufficient to withstand the projected additional collateral
losses, no collateral losses will be realized by our class and we expect to collect all contractual principal and interest of
the security we own. Remaining credit enhancement is measured in terms of subordination from other classes of
securities in the trust being contractually obligated to absorb losses before the class of security we own.
For securities where there is insufficient remaining credit enhancement for the class of securities we own, a
recovery value is calculated based on our best estimate of future cash flows specific to that security. This estimate is
based on the contractual principal payments and current interest payments of the securities we own, adjusted for actual
cumulative collateral losses incurred to date and the projected additional collateral losses expected to be incurred. In
instances where the recovery value of the security is less than its amortized cost, a credit loss is recorded in earnings.
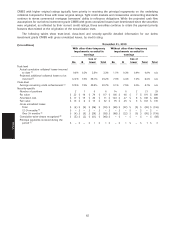
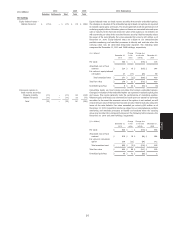
26.6%, 60.9% and 9.4% of the fair value of our below investment grade CMBS with gross unrealized losses were
issued with Aaa, Aa and A original ratings and capital structure classifications, respectively. As described previously,
81
MD&A