Allstate 2011 Annual Report Download - page 137
Download and view the complete annual report
Please find page 137 of the 2011 Allstate annual report below. You can navigate through the pages in the report by either clicking on the pages listed below, or by using the keyword search tool below to find specific information within the annual report.-
 1
1 -
2
-
3
-
4
-
5
-
6
-
7
-
8
-
9
-
10
-
11
-
12
-
13
-
14
-
15
-
16
-
17
-
18
-
19
-
20
-
21
-
22
-
23
-
24
-
25
-
26
-
27
-
28
-
29
-
30
-
31
-
32
-
33
-
34
-
35
-
36
-
37
-
38
-
39
-
40
-
41
-
42
-
43
-
44
-
45
-
46
-
47
-
48
-
49
-
50
-
51
-
52
-
53
-
54
-
55
-
56
-
57
-
58
-
59
-
60
-
61
-
62
-
63
-
64
-
65
-
66
-
67
-
68
-
69
-
70
-
71
-
72
-
73
-
74
-
75
-
76
-
77
-
78
-
79
-
80
-
81
-
82
-
83
-
84
-
85
-
86
-
87
-
88
-
89
-
90
-
91
-
92
-
93
-
94
-
95
-
96
-
97
-
98
-
99
-
100
-
101
-
102
-
103
-
104
-
105
-
106
-
107
-
108
-
109
-
110
-
111
-
112
-
113
-
114
-
115
-
116
-
117
-
118
-
119
-
120
-
121
-
122
-
123
-
124
-
125
-
126
-
 127
127 -
 128
128 -
 129
129 -
 130
130 -
 131
131 -
 132
132 -
 133
133 -
 134
134 -
 135
135 -
 136
136 -
 137
137 -
 138
138 -
 139
139 -
 140
140 -
 141
141 -
 142
142 -
 143
143 -
 144
144 -
 145
145 -
 146
146 -
 147
147 -
148
-
149
-
150
-
151
-
152
-
153
-
154
-
155
-
156
-
157
-
158
-
159
-
160
-
161
-
162
-
163
-
164
-
165
-
166
-
167
-
168
-
169
-
170
-
171
-
172
-
173
-
174
-
175
-
176
-
177
-
178
-
179
-
180
-
181
-
182
-
183
-
184
-
185
-
186
-
187
-
188
-
189
-
190
-
191
-
192
-
193
-
194
-
195
-
196
-
197
-
198
-
199
-
200
-
201
-
202
-
203
-
204
-
205
-
206
-
207
-
208
-
209
-
210
-
211
-
212
-
213
-
214
-
215
-
216
-
217
-
218
-
219
-
220
-
221
-
222
-
223
-
224
-
225
-
226
-
227
-
228
-
229
-
230
-
231
-
232
-
233
-
234
-
235
-
236
-
237
-
238
-
239
-
240
-
241
-
242
-
243
-
244
-
245
-
246
-
247
-
248
-
249
-
250
-
251
-
252
-
253
-
254
-
255
-
256
-
257
-
258
-
259
-
260
-
261
-
262
-
263
-
264
-
265
-
266
-
267
-
268
-
269
-
270
-
271
-
272
-
273
-
274
-
275
-
276
 |
 |

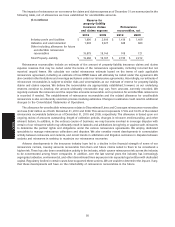
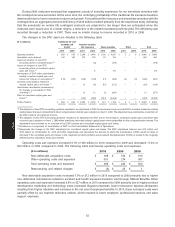
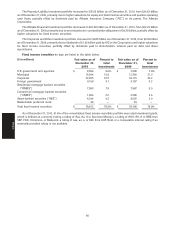
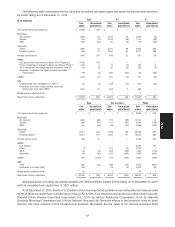
cumulative contract maturities, benefits, surrenders, withdrawals and contract charges for mortality or administrative
expenses. The following table shows the changes in contractholder funds for the years ended December 31.
($ in millions) 2010 2009 2008
Contractholder funds, beginning balance $ 52,582 $ 58,413 $ 61,975
Deposits
Fixed annuities 932 1,964 3,802
Institutional products (funding agreements) — — 4,158
Interest-sensitive life insurance 1,512 1,438 1,404
Bank and other deposits 994 1,178 1,038
Total deposits 3,438 4,580 10,402
Interest credited 1,794 2,025 2,405
Maturities, benefits, withdrawals and other adjustments
Maturities and retirements of institutional products (1,833) (4,773) (8,599)
Benefits (1,552) (1,588) (1,710)
Surrenders and partial withdrawals (5,203) (5,172) (5,313)
Contract charges (983) (918) (870)
Net transfers from separate accounts 11 11 19
Fair value hedge adjustments for institutional products (196) 25 (56)
Other adjustments (1) 137 (21) 160
Total maturities, benefits, withdrawals and other adjustments (9,619) (12,436) (16,369)
Contractholder funds, ending balance $ 48,195 $ 52,582 $ 58,413
(1) The table above illustrates the changes in contractholder funds, which are presented gross of reinsurance recoverables on the
Consolidated Statements of Financial Position. The table above is intended to supplement our discussion and analysis of revenues,
which are presented net of reinsurance on the Consolidated Statements of Operations. As a result, the net change in contractholder
funds associated with products reinsured to third parties is reflected as a component of the other adjustments line.
Contractholder funds decreased 8.3%, 10.0% and 5.8% in 2010, 2009 and 2008, respectively. Average
contractholder funds decreased 9.2% in 2010 compared to 2009 and 7.8% in 2009 compared to 2008.
Contractholder deposits decreased 24.9% in 2010 compared to 2009 primarily due to lower deposits on fixed
annuities. Deposits on fixed annuities decreased 52.5% in 2010 compared to 2009 due to our strategic decision to
discontinue distributing fixed annuities through banks and broker-dealers and our goal to reduce our concentration in
spread based products and improve returns on new business.
Contractholder deposits decreased 56.0% in 2009 compared to 2008 because there were no issuances of
institutional products in 2009 compared to $4.16 billion in 2008 and due to lower deposits on fixed annuities in 2009.
Sales of our institutional products vary from period to period based on management’s assessment of market conditions,
investor demand and operational priorities such as our focus beginning in 2009 on reducing our concentration in
spread based products. Deposits on fixed annuities decreased 48.3% in 2009 compared to 2008 due to pricing actions to
improve returns on new business and reduce our concentration in spread based products.
Maturities and retirements of institutional products decreased 61.6% to $1.83 billion in 2010 from $4.77 billion in
2009. During 2009, we retired all of our remaining outstanding extendible institutional market obligations totaling
$1.45 billion. In addition, 2009 included the redemption of $1.39 billion of institutional product liabilities in conjunction
with cash tender offers.
Maturities and retirements of institutional products decreased 44.5% to $4.77 billion in 2009 from $8.60 billion in
2008. The decrease was primarily due to lower retirements of extendible institutional market obligations in 2009
compared to 2008, partially offset by the redemption in 2009 of institutional product liabilities in accordance with the
cash tender offers.
Surrenders and partial withdrawals on deferred fixed annuities, interest-sensitive life insurance products and
Allstate Bank products (including maturities of certificates of deposit) increased 0.6% to $5.20 billion in 2010 from
$5.17 billion in 2009, and decreased 2.7% in 2009 from $5.31 billion in 2008. In 2010, the increase was primarily due to
higher surrenders and partial withdrawals on fixed annuities, partially offset by lower surrenders and partial
withdrawals on Allstate Bank products. In 2009, the decrease was due to lower surrenders and partial withdrawals on
traditional fixed annuities, partially offset by higher surrenders and partial withdrawals on market value adjusted
57
MD&A