Allstate 2011 Annual Report Download - page 38
Download and view the complete annual report
Please find page 38 of the 2011 Allstate annual report below. You can navigate through the pages in the report by either clicking on the pages listed below, or by using the keyword search tool below to find specific information within the annual report.-
 1
1 -
2
-
3
-
4
-
5
-
6
-
7
-
8
-
9
-
10
-
11
-
12
-
13
-
14
-
15
-
16
-
17
-
18
-
19
-
20
-
21
-
22
-
23
-
24
-
25
-
26
-
27
-
 28
28 -
 29
29 -
 30
30 -
 31
31 -
 32
32 -
 33
33 -
 34
34 -
 35
35 -
 36
36 -
 37
37 -
 38
38 -
 39
39 -
 40
40 -
 41
41 -
 42
42 -
 43
43 -
 44
44 -
 45
45 -
 46
46 -
 47
47 -
 48
48 -
49
-
50
-
51
-
52
-
53
-
54
-
55
-
56
-
57
-
58
-
59
-
60
-
61
-
62
-
63
-
64
-
65
-
66
-
67
-
68
-
69
-
70
-
71
-
72
-
73
-
74
-
75
-
76
-
77
-
78
-
79
-
80
-
81
-
82
-
83
-
84
-
85
-
86
-
87
-
88
-
89
-
90
-
91
-
92
-
93
-
94
-
95
-
96
-
97
-
98
-
99
-
100
-
101
-
102
-
103
-
104
-
105
-
106
-
107
-
108
-
109
-
110
-
111
-
112
-
113
-
114
-
115
-
116
-
117
-
118
-
119
-
120
-
121
-
122
-
123
-
124
-
125
-
126
-
127
-
128
-
129
-
130
-
131
-
132
-
133
-
134
-
135
-
136
-
137
-
138
-
139
-
140
-
141
-
142
-
143
-
144
-
145
-
146
-
147
-
148
-
149
-
150
-
151
-
152
-
153
-
154
-
155
-
156
-
157
-
158
-
159
-
160
-
161
-
162
-
163
-
164
-
165
-
166
-
167
-
168
-
169
-
170
-
171
-
172
-
173
-
174
-
175
-
176
-
177
-
178
-
179
-
180
-
181
-
182
-
183
-
184
-
185
-
186
-
187
-
188
-
189
-
190
-
191
-
192
-
193
-
194
-
195
-
196
-
197
-
198
-
199
-
200
-
201
-
202
-
203
-
204
-
205
-
206
-
207
-
208
-
209
-
210
-
211
-
212
-
213
-
214
-
215
-
216
-
217
-
218
-
219
-
220
-
221
-
222
-
223
-
224
-
225
-
226
-
227
-
228
-
229
-
230
-
231
-
232
-
233
-
234
-
235
-
236
-
237
-
238
-
239
-
240
-
241
-
242
-
243
-
244
-
245
-
246
-
247
-
248
-
249
-
250
-
251
-
252
-
253
-
254
-
255
-
256
-
257
-
258
-
259
-
260
-
261
-
262
-
263
-
264
-
265
-
266
-
267
-
268
-
269
-
270
-
271
-
272
-
273
-
274
-
275
-
276
 |
 |

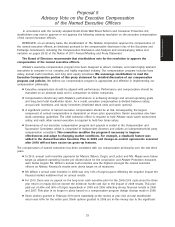
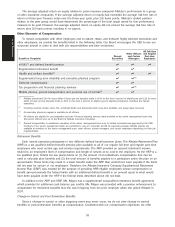
Executive Compensation
Compensation Committee Report
The Compensation and Succession Committee (‘‘the Committee’’) has reviewed and discussed the
Compensation Discussion and Analysis, contained on pages 28 through 39 of this proxy statement, with
management and, based on such review and discussions, the Committee recommended to the Board that the
Compensation Discussion and Analysis be included in this proxy statement.
THE COMPENSATION AND SUCCESSION COMMITTEE
H. John Riley, Jr. (Chairman)
Robert D. Beyer Ronald T. LeMay
W. James Farrell Andrea Redmond
Jack M. Greenberg Joshua I. Smith
Compensation Discussion and Analysis (‘‘CD&A’’)
Executive Summary
Company Performance
Allstate made continued progress on its business strategies in 2010 to position the corporation for long-term
growth. Net income increased to $928 million in 2010 from $854 million in 2009. Book value per diluted share at
December 31, 2010, was 14.5% higher than prior year end. Also in 2010, total stockholder return was 8.8%. In
November, we commenced a $1.0 billion share repurchase program.
Allstate Protection’s 2010 results reflect its strategic initiatives and the continued impact of high catastrophe
losses and increased auto claim frequency. Positive momentum in new business and in retention rates was offset
by the effects of efforts to improve profitability in several large states. Allstate brand standard auto new issued
applications increased 12.9% on a countrywide basis excluding Florida and California. Overall customer retention
declined due in part to efforts to raise profitability in several large states. Underwriting profit was below the prior
year due to increased auto claim frequency and higher catastrophe losses.
Allstate Financial made great progress in strategically repositioning the business and lowering costs. Allstate
Financial premiums and contract charges for underwritten products increased 12.2% in 2010. Allstate Financial
reported net income of $58 million in 2010 compared to a net loss of $483 million in 2009.
Our investment strategies were well timed and executed as we continued to stay long on corporate credit
while reducing our municipal bond and real estate portfolios. As a result, the consolidated investment portfolio
ended the year at $100.5 billion, $650 million higher than the end of 2009, with the improved valuation of the
portfolio more than offsetting the impact of lower contractholder funds for Allstate Financial. Investment income
was lower reflecting lower reinvestment rates and aggressive risk mitigation programs. These programs did lead
to a positive $3.71 billion valuation increase as unrealized net capital gains were $1.39 billion as of December 31,
2010, improving from unrealized net capital losses of $2.32 billion as of December 31, 2009.
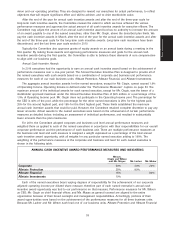
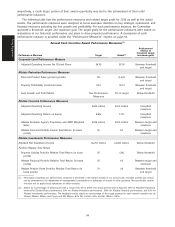
Pay for Performance
Each year the Committee reviews the overall design of our executive compensation program to ensure
compensation is aligned with both annual and long-term performance. At target levels of performance, annual
and long-term incentive awards are designed to constitute a significant percentage of an executive’s total core
compensation and provide a strong link to Allstate’s performance. Additionally, the delivery of the largest portion
of incentive compensation through stock options provides even greater alignment with stockholder interests
because the stock price must appreciate from the date of grant for any value to be delivered to executives. The
28
Proxy Statement