Allstate 2011 Annual Report Download - page 119
Download and view the complete annual report
Please find page 119 of the 2011 Allstate annual report below. You can navigate through the pages in the report by either clicking on the pages listed below, or by using the keyword search tool below to find specific information within the annual report.-
 1
1 -
2
-
3
-
4
-
5
-
6
-
7
-
8
-
9
-
10
-
11
-
12
-
13
-
14
-
15
-
16
-
17
-
18
-
19
-
20
-
21
-
22
-
23
-
24
-
25
-
26
-
27
-
28
-
29
-
30
-
31
-
32
-
33
-
34
-
35
-
36
-
37
-
38
-
39
-
40
-
41
-
42
-
43
-
44
-
45
-
46
-
47
-
48
-
49
-
50
-
51
-
52
-
53
-
54
-
55
-
56
-
57
-
58
-
59
-
60
-
61
-
62
-
63
-
64
-
65
-
66
-
67
-
68
-
69
-
70
-
71
-
72
-
73
-
74
-
75
-
76
-
77
-
78
-
79
-
80
-
81
-
82
-
83
-
84
-
85
-
86
-
87
-
88
-
89
-
90
-
91
-
92
-
93
-
94
-
95
-
96
-
97
-
98
-
99
-
100
-
101
-
102
-
103
-
104
-
105
-
106
-
107
-
108
-
 109
109 -
 110
110 -
 111
111 -
 112
112 -
 113
113 -
 114
114 -
 115
115 -
 116
116 -
 117
117 -
 118
118 -
 119
119 -
 120
120 -
 121
121 -
 122
122 -
 123
123 -
 124
124 -
 125
125 -
 126
126 -
 127
127 -
 128
128 -
 129
129 -
130
-
131
-
132
-
133
-
134
-
135
-
136
-
137
-
138
-
139
-
140
-
141
-
142
-
143
-
144
-
145
-
146
-
147
-
148
-
149
-
150
-
151
-
152
-
153
-
154
-
155
-
156
-
157
-
158
-
159
-
160
-
161
-
162
-
163
-
164
-
165
-
166
-
167
-
168
-
169
-
170
-
171
-
172
-
173
-
174
-
175
-
176
-
177
-
178
-
179
-
180
-
181
-
182
-
183
-
184
-
185
-
186
-
187
-
188
-
189
-
190
-
191
-
192
-
193
-
194
-
195
-
196
-
197
-
198
-
199
-
200
-
201
-
202
-
203
-
204
-
205
-
206
-
207
-
208
-
209
-
210
-
211
-
212
-
213
-
214
-
215
-
216
-
217
-
218
-
219
-
220
-
221
-
222
-
223
-
224
-
225
-
226
-
227
-
228
-
229
-
230
-
231
-
232
-
233
-
234
-
235
-
236
-
237
-
238
-
239
-
240
-
241
-
242
-
243
-
244
-
245
-
246
-
247
-
248
-
249
-
250
-
251
-
252
-
253
-
254
-
255
-
256
-
257
-
258
-
259
-
260
-
261
-
262
-
263
-
264
-
265
-
266
-
267
-
268
-
269
-
270
-
271
-
272
-
273
-
274
-
275
-
276
 |
 |

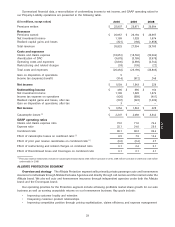
increase in freeze related claims, driven by winter weather in the first quarter of 2009. Theft claims also drove part of the
increase in frequencies in 2009 compared to 2008. In 2009, homeowner claims severity, excluding catastrophes,
increased compared to 2008.
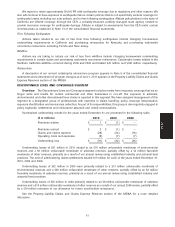
Expense ratio for Allstate Protection increased 0.5 points in 2010 compared to 2009. Restructuring costs
decreased 0.3 points in 2010 compared to 2009, driven by prior year costs associated with claim office consolidations,
reorganization of Business Insurance and technology prioritization and efficiency efforts. Excluding restructuring, the
expense ratio for Allstate Protection increased 0.8 points in 2010 compared to 2009, driven by additional marketing
expenses and increases in net costs of employee benefits, partially offset by reduced guaranty fund accrual levels and
improved operational efficiencies. The expense ratio for Allstate Protection decreased 0.4 points in 2009 compared to
2008 primarily due to the impact of lower earned premium offset by improved operational efficiencies and more focused
spending, particularly on technology, and decreases in the net cost of benefits due to favorable investment results.
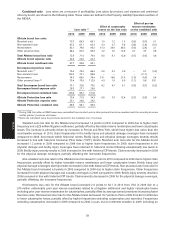
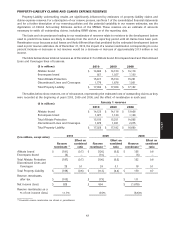
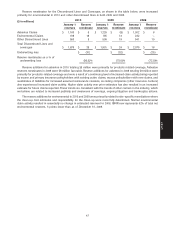
The impact of specific costs and expenses on the expense ratio are included in the following table.
Allstate brand Encompass brand Allstate Protection
2010 2009 2008 2010 2009 2008 2010 2009 2008
Amortization of DAC 14.0 14.2 14.4 18.3 18.5 19.9 14.2 14.5 14.7
Other costs and expenses 10.8 9.9 10.2 9.7 8.3 8.9 10.8 9.7 10.2
Restructuring and related charges 0.1 0.4 0.1 0.5 0.3 — 0.1 0.4 0.1
Total expense ratio 24.9 24.5 24.7 28.5 27.1 28.8 25.1 24.6 25.0
The expense ratio for the standard auto and homeowners businesses generally approximates the total Allstate
Protection expense ratio. The expense ratio for the non-standard auto business generally is lower than the total Allstate
Protection expense ratio due to lower agent commission rates and higher average premiums for non-standard auto as
compared to standard auto. The Encompass brand DAC amortization is higher on average than Allstate brand DAC
amortization due to higher commission rates.
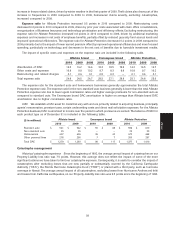
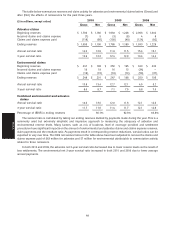
DAC We establish a DAC asset for costs that vary with and are primarily related to acquiring business, principally
agents’ remuneration, premium taxes, certain underwriting costs and direct mail solicitation expenses. For the Allstate
Protection business, DAC is amortized to income over the period in which premiums are earned. The balance of DAC for
each product type as of December 31 is included in the following table.
Allstate brand Encompass brand Allstate Protection
($ in millions)
2010 2009 2010 2009 2010 2009
Standard auto $ 541 $ 542 $ 55 $ 68 $ 596 $ 610
Non-standard auto 25 35 — — 25 35
Homeowners 437 426 36 42 473 468
Other personal lines 276 290 7 7 283 297
Total DAC $ 1,279 $ 1,293 $ 98 $ 117 $ 1,377 $ 1,410
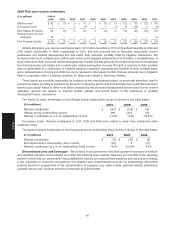
Catastrophe management
Historical catastrophe experience Since the beginning of 1992, the average annual impact of catastrophes on our
Property-Liability loss ratio was 7.5 points. However, this average does not reflect the impact of some of the more
significant actions we have taken to limit our catastrophe exposure. Consequently, it is useful to consider the impact of
catastrophes after excluding losses that are now partially or substantially covered by the California Earthquake
Authority (‘‘CEA’’), the Florida Hurricane Catastrophe Fund (‘‘FHCF’’) or placed with a third party, such as hurricane
coverage in Hawaii. The average annual impact of all catastrophes, excluding losses from Hurricanes Andrew and Iniki
and losses from California earthquakes, on our Property-Liability loss ratio was 6.5 points since the beginning of 1992.
39
MD&A