Allstate 2011 Annual Report Download - page 168
Download and view the complete annual report
Please find page 168 of the 2011 Allstate annual report below. You can navigate through the pages in the report by either clicking on the pages listed below, or by using the keyword search tool below to find specific information within the annual report.-
 1
1 -
2
-
3
-
4
-
5
-
6
-
7
-
8
-
9
-
10
-
11
-
12
-
13
-
14
-
15
-
16
-
17
-
18
-
19
-
20
-
21
-
22
-
23
-
24
-
25
-
26
-
27
-
28
-
29
-
30
-
31
-
32
-
33
-
34
-
35
-
36
-
37
-
38
-
39
-
40
-
41
-
42
-
43
-
44
-
45
-
46
-
47
-
48
-
49
-
50
-
51
-
52
-
53
-
54
-
55
-
56
-
57
-
58
-
59
-
60
-
61
-
62
-
63
-
64
-
65
-
66
-
67
-
68
-
69
-
70
-
71
-
72
-
73
-
74
-
75
-
76
-
77
-
78
-
79
-
80
-
81
-
82
-
83
-
84
-
85
-
86
-
87
-
88
-
89
-
90
-
91
-
92
-
93
-
94
-
95
-
96
-
97
-
98
-
99
-
100
-
101
-
102
-
103
-
104
-
105
-
106
-
107
-
108
-
109
-
110
-
111
-
112
-
113
-
114
-
115
-
116
-
117
-
118
-
119
-
120
-
121
-
122
-
123
-
124
-
125
-
126
-
127
-
128
-
129
-
130
-
131
-
132
-
133
-
134
-
135
-
136
-
137
-
138
-
139
-
140
-
141
-
142
-
143
-
144
-
145
-
146
-
147
-
148
-
149
-
150
-
151
-
152
-
153
-
154
-
155
-
156
-
157
-
 158
158 -
 159
159 -
 160
160 -
 161
161 -
 162
162 -
 163
163 -
 164
164 -
 165
165 -
 166
166 -
 167
167 -
 168
168 -
 169
169 -
 170
170 -
 171
171 -
 172
172 -
 173
173 -
 174
174 -
 175
175 -
 176
176 -
 177
177 -
 178
178 -
179
-
180
-
181
-
182
-
183
-
184
-
185
-
186
-
187
-
188
-
189
-
190
-
191
-
192
-
193
-
194
-
195
-
196
-
197
-
198
-
199
-
200
-
201
-
202
-
203
-
204
-
205
-
206
-
207
-
208
-
209
-
210
-
211
-
212
-
213
-
214
-
215
-
216
-
217
-
218
-
219
-
220
-
221
-
222
-
223
-
224
-
225
-
226
-
227
-
228
-
229
-
230
-
231
-
232
-
233
-
234
-
235
-
236
-
237
-
238
-
239
-
240
-
241
-
242
-
243
-
244
-
245
-
246
-
247
-
248
-
249
-
250
-
251
-
252
-
253
-
254
-
255
-
256
-
257
-
258
-
259
-
260
-
261
-
262
-
263
-
264
-
265
-
266
-
267
-
268
-
269
-
270
-
271
-
272
-
273
-
274
-
275
-
276
 |
 |

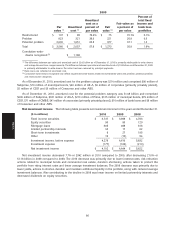
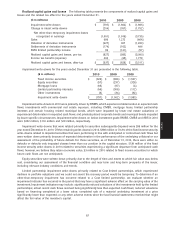
Impairment write-downs in 2009 were primarily the result of recovery assessments related to investments with
commercial real estate exposure, including limited partnership interests, equity securities, mortgage loans and CMBS;
RMBS which experienced deterioration in expected cash flows; ABS, including CDO squared, cash flow CDO and
synthetic CDO, and hybrid corporate fixed income securities.
Change in intent write-downs for the years ended December 31 are presented in the following table.
($ in millions) 2010 2009 2008
Fixed income securities $ (198) $ (318) $ (1,555)
Equity securities — (27) (120)
Mortgage loans (6) (6) (74)
Other investments — (6) (3)
Change in intent write-downs $ (204) $ (357) $ (1,752)
The change in intent write-downs in 2010 and 2009 were primarily a result of ongoing comprehensive reviews of
our portfolios resulting in write-downs of individually identified investments, primarily municipal bonds and RMBS.
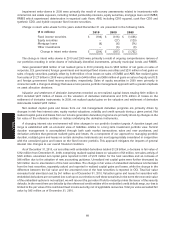
Sales generated $686 million of net realized gains in 2010 primarily due to $595 million of net gains on sales of
corporate, U.S. government, foreign government and municipal fixed income securities and $210 million of net gains on
sales of equity securities, partially offset by $139 million of net losses on sales of CMBS and ABS. Net realized gains
from sales of $1.27 billion in 2009 were primarily due to $445 million and $636 million of gains on sales of equity and U.S.
and foreign government fixed income securities, respectively. Sales of equity securities in 2009 were primarily in
connection with a change in strategy that uses a more passive portfolio management approach with a greater emphasis
on asset allocation decisions.
Valuation and settlement of derivative instruments recorded as net realized capital losses totaling $601 million in
2010 included $427 million of losses on the valuation of derivative instruments and $174 million of losses on the
settlement of derivative instruments. In 2009, net realized capital gains on the valuation and settlement of derivative
instruments totaled $205 million.
Net realized capital gains and losses from our risk management derivative programs are primarily driven by
changes in risk-free interest rates, equity market valuations, volatility and credit spreads during a given period. Net
realized capital gains and losses from our income generation derivative programs are primarily driven by changes in the
fair value of the reference entities or indices underlying the derivative instruments.
A changing interest rate environment will drive changes in our portfolio duration targets. A duration target and
range is established with an economic view of liabilities relative to a long-term investment portfolio view. Tactical
duration management is accomplished through both cash market transactions, sales and new purchases, and
derivative activities that generate realized gains and losses. As a component of our approach to managing portfolio
duration, realized gains and losses on certain derivative instruments are most appropriately considered in conjunction
with the unrealized gains and losses on the fixed income portfolio. This approach mitigates the impacts of general
interest rate changes to our overall financial condition.
As of December 31, 2010, our securities with embedded derivatives totaled $1.26 billion, a decrease in fair value of
$152 million from December 31, 2009, comprising realized capital losses on valuation of $3 million, net sales activity of
$320 million, unrealized net capital gains reported in OCI of $123 million for the host securities and an increase of
$48 million due to the adoption of new accounting guidance. Unrealized net capital gains were further decreased by
$30 million due to amortization of the host securities. The change in fair value of embedded derivatives is bifurcated
from the host securities, separately valued and reported in realized capital gains and losses, while the change in the
difference between the fair value and the amortized cost of the host securities is reported in OCI. Total fair value
exceeded total amortized cost by $41 million as of December 31, 2010. Valuation gains and losses for securities with
embedded derivatives are converted into cash upon our election to sell these securities. In the event the economic value
of the embedded options is not realized, we will recover the par value if held to maturity unless the issuer of the security
defaults. In the event there are defaults by the referenced credit entities of the embedded credit default swap, our loss is
limited to the par value of the combined fixed income security, net of applicable recoveries. Total par value exceeded fair
value by $45 million as of December 31, 2010.
88
MD&A