Allstate 2011 Annual Report Download - page 146
Download and view the complete annual report
Please find page 146 of the 2011 Allstate annual report below. You can navigate through the pages in the report by either clicking on the pages listed below, or by using the keyword search tool below to find specific information within the annual report.-
 1
1 -
2
-
3
-
4
-
5
-
6
-
7
-
8
-
9
-
10
-
11
-
12
-
13
-
14
-
15
-
16
-
17
-
18
-
19
-
20
-
21
-
22
-
23
-
24
-
25
-
26
-
27
-
28
-
29
-
30
-
31
-
32
-
33
-
34
-
35
-
36
-
37
-
38
-
39
-
40
-
41
-
42
-
43
-
44
-
45
-
46
-
47
-
48
-
49
-
50
-
51
-
52
-
53
-
54
-
55
-
56
-
57
-
58
-
59
-
60
-
61
-
62
-
63
-
64
-
65
-
66
-
67
-
68
-
69
-
70
-
71
-
72
-
73
-
74
-
75
-
76
-
77
-
78
-
79
-
80
-
81
-
82
-
83
-
84
-
85
-
86
-
87
-
88
-
89
-
90
-
91
-
92
-
93
-
94
-
95
-
96
-
97
-
98
-
99
-
100
-
101
-
102
-
103
-
104
-
105
-
106
-
107
-
108
-
109
-
110
-
111
-
112
-
113
-
114
-
115
-
116
-
117
-
118
-
119
-
120
-
121
-
122
-
123
-
124
-
125
-
126
-
127
-
128
-
129
-
130
-
131
-
132
-
133
-
134
-
135
-
 136
136 -
 137
137 -
 138
138 -
 139
139 -
 140
140 -
 141
141 -
 142
142 -
 143
143 -
 144
144 -
 145
145 -
 146
146 -
 147
147 -
 148
148 -
 149
149 -
 150
150 -
 151
151 -
 152
152 -
 153
153 -
 154
154 -
 155
155 -
 156
156 -
157
-
158
-
159
-
160
-
161
-
162
-
163
-
164
-
165
-
166
-
167
-
168
-
169
-
170
-
171
-
172
-
173
-
174
-
175
-
176
-
177
-
178
-
179
-
180
-
181
-
182
-
183
-
184
-
185
-
186
-
187
-
188
-
189
-
190
-
191
-
192
-
193
-
194
-
195
-
196
-
197
-
198
-
199
-
200
-
201
-
202
-
203
-
204
-
205
-
206
-
207
-
208
-
209
-
210
-
211
-
212
-
213
-
214
-
215
-
216
-
217
-
218
-
219
-
220
-
221
-
222
-
223
-
224
-
225
-
226
-
227
-
228
-
229
-
230
-
231
-
232
-
233
-
234
-
235
-
236
-
237
-
238
-
239
-
240
-
241
-
242
-
243
-
244
-
245
-
246
-
247
-
248
-
249
-
250
-
251
-
252
-
253
-
254
-
255
-
256
-
257
-
258
-
259
-
260
-
261
-
262
-
263
-
264
-
265
-
266
-
267
-
268
-
269
-
270
-
271
-
272
-
273
-
274
-
275
-
276
 |
 |

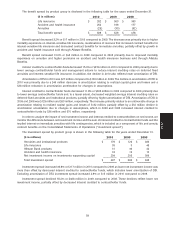
The Property-Liability investment portfolio increased to $35.05 billion as of December 31, 2010, from $34.53 billion
as of December 31, 2009, primarily due to higher valuations for equity and fixed income securities and positive operating
cash flows, partially offset by dividends paid by Allstate Insurance Company (‘‘AIC’’) to its parent, The Allstate
Corporation.
The Allstate Financial investment portfolio decreased to $61.58 billion as of December 31, 2010, from $62.22 billion
as of December 31, 2009, primarily due to net reductions in contractholder obligations of $4.39 billion, partially offset by
higher valuations for fixed income securities.
The Corporate and Other investment portfolio increased to $3.85 billion as of December 31, 2010, from $3.09 billion
as of December 31, 2009, primarily due to dividends of $1.30 billion paid by AIC to the Corporation and higher valuations
for fixed income securities, partially offset by dividends paid to shareholders, interest paid on debt and share
repurchases.
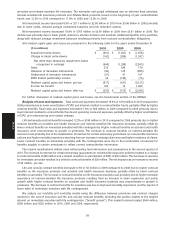
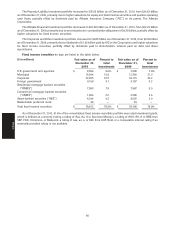
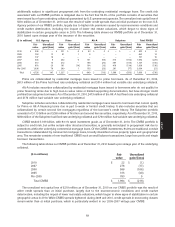
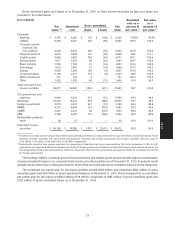
Fixed income securities by type are listed in the table below.
($ in millions) Fair value as of Percent to Fair value as of Percent to
December 31, total December 31, total
2010 investments 2009 investments
U.S. government and agencies $ 8,596 8.6% $ 7,536 7.6%
Municipal 15,934 15.9 21,280 21.3
Corporate 37,655 37.5 33,115 33.2
Foreign government 3,158 3.1 3,197 3.2
Residential mortgage-backed securities
(‘‘RMBS’’) 7,993 7.9 7,987 8.0
Commercial mortgage-backed securities
(‘‘CMBS’’) 1,994 2.0 2,586 2.6
Asset-backed securities (‘‘ABS’’) 4,244 4.2 3,026 3.0
Redeemable preferred stock 38 — 39 —
Total fixed income securities $ 79,612 79.2% $ 78,766 78.9%
As of December 31, 2010, 91.6% of the consolidated fixed income securities portfolio was rated investment grade,
which is defined as a security having a rating of Aaa, Aa, A or Baa from Moody’s, a rating of AAA, AA, A or BBB from
S&P, Fitch, Dominion, or Realpoint, a rating of aaa, aa, a, or bbb from A.M. Best, or a comparable internal rating if an
externally provided rating is not available.
66
MD&A