Allstate 2011 Annual Report Download - page 270
Download and view the complete annual report
Please find page 270 of the 2011 Allstate annual report below. You can navigate through the pages in the report by either clicking on the pages listed below, or by using the keyword search tool below to find specific information within the annual report.-
 1
1 -
2
-
3
-
4
-
5
-
6
-
7
-
8
-
9
-
10
-
11
-
12
-
13
-
14
-
15
-
16
-
17
-
18
-
19
-
20
-
21
-
22
-
23
-
24
-
25
-
26
-
27
-
28
-
29
-
30
-
31
-
32
-
33
-
34
-
35
-
36
-
37
-
38
-
39
-
40
-
41
-
42
-
43
-
44
-
45
-
46
-
47
-
48
-
49
-
50
-
51
-
52
-
53
-
54
-
55
-
56
-
57
-
58
-
59
-
60
-
61
-
62
-
63
-
64
-
65
-
66
-
67
-
68
-
69
-
70
-
71
-
72
-
73
-
74
-
75
-
76
-
77
-
78
-
79
-
80
-
81
-
82
-
83
-
84
-
85
-
86
-
87
-
88
-
89
-
90
-
91
-
92
-
93
-
94
-
95
-
96
-
97
-
98
-
99
-
100
-
101
-
102
-
103
-
104
-
105
-
106
-
107
-
108
-
109
-
110
-
111
-
112
-
113
-
114
-
115
-
116
-
117
-
118
-
119
-
120
-
121
-
122
-
123
-
124
-
125
-
126
-
127
-
128
-
129
-
130
-
131
-
132
-
133
-
134
-
135
-
136
-
137
-
138
-
139
-
140
-
141
-
142
-
143
-
144
-
145
-
146
-
147
-
148
-
149
-
150
-
151
-
152
-
153
-
154
-
155
-
156
-
157
-
158
-
159
-
160
-
161
-
162
-
163
-
164
-
165
-
166
-
167
-
168
-
169
-
170
-
171
-
172
-
173
-
174
-
175
-
176
-
177
-
178
-
179
-
180
-
181
-
182
-
183
-
184
-
185
-
186
-
187
-
188
-
189
-
190
-
191
-
192
-
193
-
194
-
195
-
196
-
197
-
198
-
199
-
200
-
201
-
202
-
203
-
204
-
205
-
206
-
207
-
208
-
209
-
210
-
211
-
212
-
213
-
214
-
215
-
216
-
217
-
218
-
219
-
220
-
221
-
222
-
223
-
224
-
225
-
226
-
227
-
228
-
229
-
230
-
231
-
232
-
233
-
234
-
235
-
236
-
237
-
238
-
239
-
240
-
241
-
242
-
243
-
244
-
245
-
246
-
247
-
248
-
249
-
250
-
251
-
252
-
253
-
254
-
255
-
256
-
257
-
258
-
259
-
 260
260 -
 261
261 -
 262
262 -
 263
263 -
 264
264 -
 265
265 -
 266
266 -
 267
267 -
 268
268 -
 269
269 -
 270
270 -
 271
271 -
 272
272 -
 273
273 -
 274
274 -
 275
275 -
 276
276
 |
 |

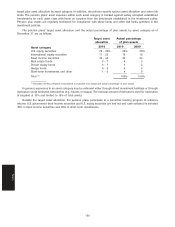
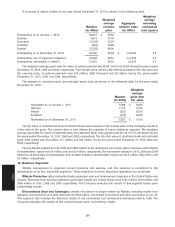
Additional significant financial performance data for each of the Company’s reportable segments for the years
ended December 31 are as follows:
($ in millions) 2010 2009 2008
Amortization of DAC
Property-Liability $ 3,678 $ 3,789 $ 3,975
Allstate Financial 356 965 704
Consolidated $ 4,034 $ 4,754 $ 4,679
Income tax expense (benefit)
Property-Liability $ 314 $ 612 $ (248)
Allstate Financial 8 (82) (954)
Corporate and Other (124) (136) (144)
Consolidated $ 198 $ 394 $ (1,346)
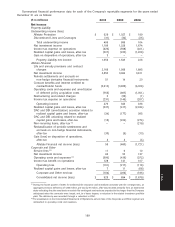
Interest expense is primarily incurred in the Corporate and Other segment. Capital expenditures for long-lived
assets are generally made in the Property-Liability segment. A portion of these long-lived assets are used by entities
included in the Allstate Financial and Corporate and Other segments and, accordingly, are charged expenses in
proportion to their use.
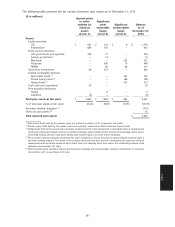
Summarized data for total assets and investments for each of the Company’s reportable segments as of
December 31 are as follows:
($ in millions) 2010 2009 2008
Assets
Property-Liability $ 47,573 $ 47,179 $ 45,967
Allstate Financial 79,069 81,968 84,929
Corporate and Other 4,232 3,505 3,902
Consolidated $ 130,874 $ 132,652 $ 134,798
Investments
Property-Liability $ 35,048 $ 34,526 $ 30,837
Allstate Financial 61,582 62,216 61,499
Corporate and Other 3,853 3,091 3,662
Consolidated $ 100,483 $ 99,833 $ 95,998
The balances above reflect the elimination of related party investments between segments.
190
Notes