Allstate 2011 Annual Report Download - page 176
Download and view the complete annual report
Please find page 176 of the 2011 Allstate annual report below. You can navigate through the pages in the report by either clicking on the pages listed below, or by using the keyword search tool below to find specific information within the annual report.-
 1
1 -
2
-
3
-
4
-
5
-
6
-
7
-
8
-
9
-
10
-
11
-
12
-
13
-
14
-
15
-
16
-
17
-
18
-
19
-
20
-
21
-
22
-
23
-
24
-
25
-
26
-
27
-
28
-
29
-
30
-
31
-
32
-
33
-
34
-
35
-
36
-
37
-
38
-
39
-
40
-
41
-
42
-
43
-
44
-
45
-
46
-
47
-
48
-
49
-
50
-
51
-
52
-
53
-
54
-
55
-
56
-
57
-
58
-
59
-
60
-
61
-
62
-
63
-
64
-
65
-
66
-
67
-
68
-
69
-
70
-
71
-
72
-
73
-
74
-
75
-
76
-
77
-
78
-
79
-
80
-
81
-
82
-
83
-
84
-
85
-
86
-
87
-
88
-
89
-
90
-
91
-
92
-
93
-
94
-
95
-
96
-
97
-
98
-
99
-
100
-
101
-
102
-
103
-
104
-
105
-
106
-
107
-
108
-
109
-
110
-
111
-
112
-
113
-
114
-
115
-
116
-
117
-
118
-
119
-
120
-
121
-
122
-
123
-
124
-
125
-
126
-
127
-
128
-
129
-
130
-
131
-
132
-
133
-
134
-
135
-
136
-
137
-
138
-
139
-
140
-
141
-
142
-
143
-
144
-
145
-
146
-
147
-
148
-
149
-
150
-
151
-
152
-
153
-
154
-
155
-
156
-
157
-
158
-
159
-
160
-
161
-
162
-
163
-
164
-
165
-
 166
166 -
 167
167 -
 168
168 -
 169
169 -
 170
170 -
 171
171 -
 172
172 -
 173
173 -
 174
174 -
 175
175 -
 176
176 -
 177
177 -
 178
178 -
 179
179 -
 180
180 -
 181
181 -
 182
182 -
 183
183 -
 184
184 -
 185
185 -
 186
186 -
187
-
188
-
189
-
190
-
191
-
192
-
193
-
194
-
195
-
196
-
197
-
198
-
199
-
200
-
201
-
202
-
203
-
204
-
205
-
206
-
207
-
208
-
209
-
210
-
211
-
212
-
213
-
214
-
215
-
216
-
217
-
218
-
219
-
220
-
221
-
222
-
223
-
224
-
225
-
226
-
227
-
228
-
229
-
230
-
231
-
232
-
233
-
234
-
235
-
236
-
237
-
238
-
239
-
240
-
241
-
242
-
243
-
244
-
245
-
246
-
247
-
248
-
249
-
250
-
251
-
252
-
253
-
254
-
255
-
256
-
257
-
258
-
259
-
260
-
261
-
262
-
263
-
264
-
265
-
266
-
267
-
268
-
269
-
270
-
271
-
272
-
273
-
274
-
275
-
276
 |
 |

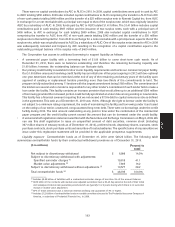
tightening of credit spreads in certain sectors. Based on assumptions described above, in the event of a 100 basis point
immediate increase in interest rates, the assets supporting life insurance products would decrease in value by
$549 million, compared to a decrease of $459 million as of December 31, 2009.
To the extent that conditions differ from the assumptions we used in these calculations, duration and rate shock
measures could be significantly impacted. Additionally, our calculations assume that the current relationship between
short-term and long-term interest rates (the term structure of interest rates) will remain constant over time. As a result,
these calculations may not fully capture the effect of non-parallel changes in the term structure of interest rates and/or
large changes in interest rates.
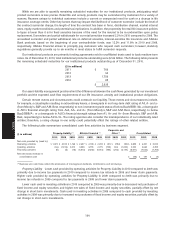
Credit spread risk is the risk that we will incur a loss due to adverse changes in credit spreads (‘‘spreads’’). This
risk arises from many of our primary activities, as we invest substantial funds in spread-sensitive fixed income assets.
We manage the spread risk in our assets. One of the measures used to quantify this exposure is spread duration.
Spread duration measures the price sensitivity of the assets to changes in spreads. For example, if spreads increase 100
basis points, the fair value of an asset exhibiting a spread duration of 5 is expected to decrease in value by 5%.
Spread duration is calculated similarly to interest rate duration. As of December 31, 2010, the spread duration of
Property-Liability assets was 4.45, compared to 5.02 as of December 31, 2009 and the spread duration of Allstate
Financial assets was 4.97, compared to 4.79 as of December 31, 2009. Based upon the information and assumptions we
use in this spread duration calculation, and spreads in effect as of December 31, 2010, we estimate that a 100 basis
point immediate, parallel increase in spreads across all asset classes, industry sectors and credit ratings (‘‘spread
shock’’) would decrease the net fair value of the assets by $3.61 billion, compared to $3.85 billion as of December 31,
2009. Reflected in the duration calculation are the effects of our risk mitigation actions that use CDS to manage spread
risk. Based on contracts in place as of December 31, 2010, we would recognize realized capital gains totaling $64 million
in the event of a 100 basis point immediate, parallel spread increase and $64 million in realized capital losses in the
event of a 100 basis point immediate, parallel spread decrease. The selection of a 100 basis point immediate parallel
change in spreads should not be construed as our prediction of future market events, but only as an illustration of the
potential effect of such an event.
Equity price risk is the risk that we will incur losses due to adverse changes in the general levels of the equity
markets. As of December 31, 2010, we held $4.67 billion in common stocks and Exchange Traded Funds (‘‘ETFs’’) and
$4.88 billion in other securities with equity risk (including primarily convertible securities, limited partnership interests,
non-redeemable preferred securities and equity-linked notes), compared to $4.77 billion and $3.86 billion, respectively,
as of December 31, 2009. 95.5% and 63.1% of these totals, respectively, represented assets of the Property-Liability
operations as of December 31, 2010, compared to 97.3% and 57.1%, respectively, as of December 31, 2009. Additionally,
we had 18,000 contracts in long Standard & Poor’s 500 Composite Price Index (‘‘S&P 500’’) puts as of December 31, 2010
with a fair value of $34 million.
As of December 31, 2010, our portfolio of common stocks and other securities with equity risk had a cash market
portfolio beta of 0.74, compared to a beta of 0.73 as of December 31, 2009. Beta represents a widely used methodology
to describe, quantitatively, an investment’s market risk characteristics relative to an index such as the S&P 500. Based on
the beta analysis, we estimate that if the S&P 500 increases or decreases by 10%, the fair value of our equity investments
will increase or decrease by 7.4%, respectively. Based upon the information and assumptions we used to calculate beta
as of December 31, 2010, including the effect of the S&P 500 puts, we estimate that an immediate decrease in the
S&P 500 of 10% would decrease the net fair value of our equity investments identified above by $695 million, compared
to $605 million as of December 31, 2009, and an immediate increase in the S&P 500 of 10% would increase the net fair
value by $708 million compared to $615 million as of December 31, 2009. In calculating the impact of a 10% S&P index
perturbation on the value of the puts, we have assumed index volatility remains constant. Based on the S&P 500 index
put options in place as of December 31, 2010, we would recognize losses totaling $14 million in the event of a 10%
increase in the S&P 500 index and $22 million in gains in the event of a 10% decrease. The selection of a 10% immediate
decrease or increase in the S&P 500 should not be construed as our prediction of future market events, but only as an
illustration of the potential effect of such an event.
The beta of our common stocks and other securities with equity risk was determined by calculating the change in
the fair value of the portfolio resulting from stressing the equity market up and down 10%. The illustrations noted above
may not reflect our actual experience if the future composition of the portfolio (hence its beta) and correlation
relationships differ from the historical relationships.
As of December 31, 2010 and 2009, we had separate accounts assets related to variable annuity and variable life
contracts with account values totaling $8.68 billion and $9.07 billion, respectively. Equity risk exists for contract charges
96
MD&A