Allstate 2011 Annual Report Download - page 177
Download and view the complete annual report
Please find page 177 of the 2011 Allstate annual report below. You can navigate through the pages in the report by either clicking on the pages listed below, or by using the keyword search tool below to find specific information within the annual report.-
 1
1 -
2
-
3
-
4
-
5
-
6
-
7
-
8
-
9
-
10
-
11
-
12
-
13
-
14
-
15
-
16
-
17
-
18
-
19
-
20
-
21
-
22
-
23
-
24
-
25
-
26
-
27
-
28
-
29
-
30
-
31
-
32
-
33
-
34
-
35
-
36
-
37
-
38
-
39
-
40
-
41
-
42
-
43
-
44
-
45
-
46
-
47
-
48
-
49
-
50
-
51
-
52
-
53
-
54
-
55
-
56
-
57
-
58
-
59
-
60
-
61
-
62
-
63
-
64
-
65
-
66
-
67
-
68
-
69
-
70
-
71
-
72
-
73
-
74
-
75
-
76
-
77
-
78
-
79
-
80
-
81
-
82
-
83
-
84
-
85
-
86
-
87
-
88
-
89
-
90
-
91
-
92
-
93
-
94
-
95
-
96
-
97
-
98
-
99
-
100
-
101
-
102
-
103
-
104
-
105
-
106
-
107
-
108
-
109
-
110
-
111
-
112
-
113
-
114
-
115
-
116
-
117
-
118
-
119
-
120
-
121
-
122
-
123
-
124
-
125
-
126
-
127
-
128
-
129
-
130
-
131
-
132
-
133
-
134
-
135
-
136
-
137
-
138
-
139
-
140
-
141
-
142
-
143
-
144
-
145
-
146
-
147
-
148
-
149
-
150
-
151
-
152
-
153
-
154
-
155
-
156
-
157
-
158
-
159
-
160
-
161
-
162
-
163
-
164
-
165
-
166
-
 167
167 -
 168
168 -
 169
169 -
 170
170 -
 171
171 -
 172
172 -
 173
173 -
 174
174 -
 175
175 -
 176
176 -
 177
177 -
 178
178 -
 179
179 -
 180
180 -
 181
181 -
 182
182 -
 183
183 -
 184
184 -
 185
185 -
 186
186 -
 187
187 -
188
-
189
-
190
-
191
-
192
-
193
-
194
-
195
-
196
-
197
-
198
-
199
-
200
-
201
-
202
-
203
-
204
-
205
-
206
-
207
-
208
-
209
-
210
-
211
-
212
-
213
-
214
-
215
-
216
-
217
-
218
-
219
-
220
-
221
-
222
-
223
-
224
-
225
-
226
-
227
-
228
-
229
-
230
-
231
-
232
-
233
-
234
-
235
-
236
-
237
-
238
-
239
-
240
-
241
-
242
-
243
-
244
-
245
-
246
-
247
-
248
-
249
-
250
-
251
-
252
-
253
-
254
-
255
-
256
-
257
-
258
-
259
-
260
-
261
-
262
-
263
-
264
-
265
-
266
-
267
-
268
-
269
-
270
-
271
-
272
-
273
-
274
-
275
-
276
 |
 |

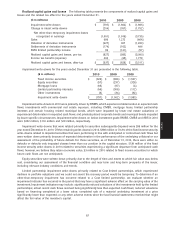
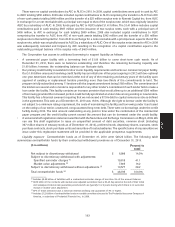
based on separate account balances and guarantees for death and/or income benefits provided by our variable
products. In 2006, we disposed of substantially all of the variable annuity business through reinsurance agreements
with The Prudential Insurance Company of America, a subsidiary of Prudential Financial Inc. and therefore mitigated this
aspect of our risk. Equity risk for our variable life business relates to contract charges and policyholder benefits. Total
variable life contract charges for 2010 and 2009 were $80 million and $85 million, respectively. Separate account
liabilities related to variable life contracts were $775 million and $708 million in December 31, 2010 and 2009,
respectively.
As of December 31, 2010 and 2009 we had $4.70 billion and $4.47 billion, respectively, in equity-indexed annuity
liabilities that provide customers with interest crediting rates based on the performance of the S&P 500. We hedge the
risk associated with these liabilities using equity-indexed options and futures, interest rate swaps, and eurodollar
futures, maintaining risk within specified value-at-risk limits.
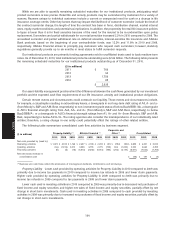
Foreign currency exchange rate risk is the risk that we will incur economic losses due to adverse changes in
foreign currency exchange rates. This risk primarily arises from our foreign equity investments, including real estate
funds and private equity funds, and our Canadian and Northern Ireland operations. We also have certain funding
agreement liabilities and fixed income securities that are denominated in foreign currencies; however, derivatives are
used to hedge the foreign currency risk of these funding agreements and approximately 77% of the fixed income
securities. As of December 31, 2010 and 2009, we had $435 million and $713 million, respectively, in funding agreements
denominated in foreign currencies.
As of December 31, 2010, we had $1.70 billion in foreign currency denominated equity investments, $773 million net
investment in our foreign subsidiaries, and $91 million in unhedged non-dollar pay fixed income securities. These
amounts were $1.38 billion, $686 million, and $148 million, respectively, as of December 31, 2009. 90.5% of the foreign
currency exposure is in the Property-Liability business.
Based upon the information and assumptions used as of December 31, 2010, we estimate that a 10% immediate
unfavorable change in each of the foreign currency exchange rates to which we are exposed would decrease the value
of our foreign currency denominated instruments by $257 million, compared with an estimated $222 million decrease as
of December 31, 2009. The selection of a 10% immediate decrease in all currency exchange rates should not be
construed as our prediction of future market events, but only as an illustration of the potential effect of such an event.
Our currency exposure is diversified across 32 currencies as of December 31, 2010, compared to 39 currencies as of
December 31, 2009. Our largest individual foreign currency exposures as of December 31, 2010 were to the Canadian
dollar (37.0%) and the British Pound (13.3%). The largest individual foreign currency exposures as of December 31, 2009
were to the Canadian dollar (35.5%) and the Euro (22.9%). Our primary regional exposure is to Canada, with 37.0% as of
December 31, 2010, compared to Western Europe, with 40.5% as of December 31, 2009.
The modeling technique we use to report our currency exposure does not take into account correlation among
foreign currency exchange rates. Even though we believe it is very unlikely that all of the foreign currency exchange
rates that we are exposed to would simultaneously decrease by 10%, we nonetheless stress test our portfolio under this
and other hypothetical extreme adverse market scenarios. Our actual experience may differ from these results because
of assumptions we have used or because significant liquidity and market events could occur that we did not foresee.
Commodity price risk is the risk that we will incur economic losses due to adverse changes in the prices of
commodities. This risk arises from commodity linked investments, such as the Dow Jones AIG Commodity Index and
Goldman Sachs Commodity Index which is a broad based, oil dominated index. As of December 31, 2010 and 2009, we
had no exposure to the indices.
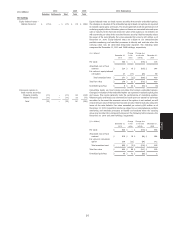
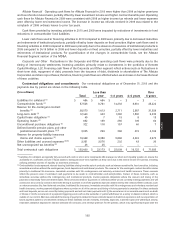
PENSION PLANS
We have defined benefit pension plans, which cover most full-time and certain part-time employees and employee-
agents. See Note 16 of the consolidated financial statements for a complete discussion of these plans and their effect on
the consolidated financial statements. The pension and other postretirement plans may be amended or terminated at
any time. Any revisions could result in significant changes to our obligations and our obligation to fund the plans.
We report unrecognized pension and other postretirement benefit cost in the Consolidated Statements of Financial
Position as a component of accumulated other comprehensive income in shareholders’ equity. It represents differences
between the fair value of plan assets and the projected benefit obligation for pension plans and the accumulated
postretirement benefit obligation for other postretirement plans that have not yet been recognized as a component of
net periodic cost. The measurement of the unrecognized pension and other postretirement benefit cost can vary based
upon the fluctuations in the fair value of the plan assets and the actuarial assumptions used for the plans as discussed
97
MD&A