Allstate 2011 Annual Report Download - page 138
Download and view the complete annual report
Please find page 138 of the 2011 Allstate annual report below. You can navigate through the pages in the report by either clicking on the pages listed below, or by using the keyword search tool below to find specific information within the annual report.-
 1
1 -
2
-
3
-
4
-
5
-
6
-
7
-
8
-
9
-
10
-
11
-
12
-
13
-
14
-
15
-
16
-
17
-
18
-
19
-
20
-
21
-
22
-
23
-
24
-
25
-
26
-
27
-
28
-
29
-
30
-
31
-
32
-
33
-
34
-
35
-
36
-
37
-
38
-
39
-
40
-
41
-
42
-
43
-
44
-
45
-
46
-
47
-
48
-
49
-
50
-
51
-
52
-
53
-
54
-
55
-
56
-
57
-
58
-
59
-
60
-
61
-
62
-
63
-
64
-
65
-
66
-
67
-
68
-
69
-
70
-
71
-
72
-
73
-
74
-
75
-
76
-
77
-
78
-
79
-
80
-
81
-
82
-
83
-
84
-
85
-
86
-
87
-
88
-
89
-
90
-
91
-
92
-
93
-
94
-
95
-
96
-
97
-
98
-
99
-
100
-
101
-
102
-
103
-
104
-
105
-
106
-
107
-
108
-
109
-
110
-
111
-
112
-
113
-
114
-
115
-
116
-
117
-
118
-
119
-
120
-
121
-
122
-
123
-
124
-
125
-
126
-
127
-
 128
128 -
 129
129 -
 130
130 -
 131
131 -
 132
132 -
 133
133 -
 134
134 -
 135
135 -
 136
136 -
 137
137 -
 138
138 -
 139
139 -
 140
140 -
 141
141 -
 142
142 -
 143
143 -
 144
144 -
 145
145 -
 146
146 -
 147
147 -
 148
148 -
149
-
150
-
151
-
152
-
153
-
154
-
155
-
156
-
157
-
158
-
159
-
160
-
161
-
162
-
163
-
164
-
165
-
166
-
167
-
168
-
169
-
170
-
171
-
172
-
173
-
174
-
175
-
176
-
177
-
178
-
179
-
180
-
181
-
182
-
183
-
184
-
185
-
186
-
187
-
188
-
189
-
190
-
191
-
192
-
193
-
194
-
195
-
196
-
197
-
198
-
199
-
200
-
201
-
202
-
203
-
204
-
205
-
206
-
207
-
208
-
209
-
210
-
211
-
212
-
213
-
214
-
215
-
216
-
217
-
218
-
219
-
220
-
221
-
222
-
223
-
224
-
225
-
226
-
227
-
228
-
229
-
230
-
231
-
232
-
233
-
234
-
235
-
236
-
237
-
238
-
239
-
240
-
241
-
242
-
243
-
244
-
245
-
246
-
247
-
248
-
249
-
250
-
251
-
252
-
253
-
254
-
255
-
256
-
257
-
258
-
259
-
260
-
261
-
262
-
263
-
264
-
265
-
266
-
267
-
268
-
269
-
270
-
271
-
272
-
273
-
274
-
275
-
276
 |
 |

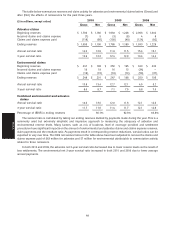
annuities and interest-sensitive life insurance. The surrender and partial withdrawal rate on deferred fixed annuities,
interest-sensitive life insurance products and Allstate Bank products, based on the beginning of year contractholder
funds, was 12.2% in 2010 compared to 11.8% in 2009 and 12.2% in 2008.
Net investment income decreased 6.9% or $211 million to $2.85 billion in 2010 from $3.06 billion in 2009 primarily
due to lower yields, reduced average investment balances and risk reduction actions.
Net investment income decreased 19.6% or $747 million to $3.06 billion in 2009 from $3.81 billion in 2008. The
decline was primarily due to lower yields, actions to shorten duration and maintain additional liquidity in the portfolio,
along with reduced average investment balances resulting primarily from reduced contractholder obligations.
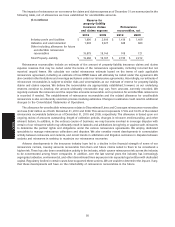
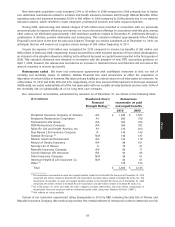
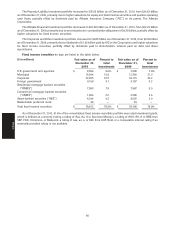
Net realized capital gains and losses are presented in the following table for the years ended December 31.
($ in millions) 2010 2009 2008
Impairment write-downs $ (501) $ (1,021) $ (1,256)
Change in intent write-downs (142) (268) (1,247)
Net other-than-temporary impairment losses
recognized in earnings (643) (1,289) (2,503)
Sales 219 638 178
Valuation of derivative instruments (94) 315 (985)
Settlements of derivative instruments (31) 41 197
EMA limited partnership income 32 (136) (14)
Realized capital gains and losses, pre-tax (517) (431) (3,127)
Income tax benefit 180 14 1,093
Realized capital gains and losses, after-tax $ (337) $ (417) $ (2,034)
For further discussion of realized capital gains and losses, see the Investments section of the MD&A.
Analysis of costs and expenses Total costs and expenses decreased 13.9% or $719 million in 2010 compared to
2009 primarily due to lower amortization of DAC and interest credited to contractholder funds, partially offset by higher
contract benefits. Total costs and expenses decreased 1.6% or $85 million in 2009 compared to 2008 primarily due to
lower interest credited to contractholder funds and operating costs and expenses, partially offset by higher amortization
of DAC and restructuring and related charges.
Life and annuity contract benefits increased 12.2% or $198 million in 2010 compared to 2009 primarily due to higher
contract benefits on accident and health insurance and interest-sensitive life insurance products, partially offset by
lower contract benefits on immediate annuities with life contingencies. Higher contract benefits on accident and health
insurance were proportionate to growth in premiums. The increase in contract benefits on interest-sensitive life
insurance was primarily due to the reestimation of reserves for certain secondary guarantees on universal life insurance
policies and higher mortality experience resulting from an increase in average claim size and higher incidence of claims.
Lower contract benefits on immediate annuities with life contingencies were due to the reestimation of reserves for
benefits payable to certain annuitants to reflect current contractholder information.
The reserve reestimations utilized more refined policy level information and assumptions in the second quarter of
2010. The increase in reserves for certain secondary guarantees on universal life insurance policies resulted in a charge
to contract benefits of $68 million and a related reduction in amortization of DAC of $50 million. The decrease in reserves
for immediate annuities resulted in a credit to contract benefits of $26 million. The net impact was an increase to income
of $8 million, pre-tax.
Life and annuity contract benefits increased 0.3% or $5 million in 2009 compared to 2008 due to higher contract
benefits on life insurance products and accident and health insurance business, partially offset by lower contract
benefits on annuities. The increase in contract benefits on life insurance products was primarily due to higher mortality
experience on interest-sensitive life insurance products resulting from an increase in claim experience and policy
growth while higher contract benefits on accident and health insurance business was proportionate to growth in
premiums. The decrease in contract benefits for annuities was due to improved mortality experience and the impact of
lower sales of immediate annuities with life contingencies.
We analyze our mortality and morbidity results using the difference between premiums and contract charges
earned for the cost of insurance and life and annuity contract benefits excluding the portion related to the implied
interest on immediate annuities with life contingencies (‘‘benefit spread’’). This implied interest totaled $549 million,
$558 million and $552 million in 2010, 2009 and 2008, respectively.
58
MD&A