Allstate 2011 Annual Report Download - page 174
Download and view the complete annual report
Please find page 174 of the 2011 Allstate annual report below. You can navigate through the pages in the report by either clicking on the pages listed below, or by using the keyword search tool below to find specific information within the annual report.-
 1
1 -
2
-
3
-
4
-
5
-
6
-
7
-
8
-
9
-
10
-
11
-
12
-
13
-
14
-
15
-
16
-
17
-
18
-
19
-
20
-
21
-
22
-
23
-
24
-
25
-
26
-
27
-
28
-
29
-
30
-
31
-
32
-
33
-
34
-
35
-
36
-
37
-
38
-
39
-
40
-
41
-
42
-
43
-
44
-
45
-
46
-
47
-
48
-
49
-
50
-
51
-
52
-
53
-
54
-
55
-
56
-
57
-
58
-
59
-
60
-
61
-
62
-
63
-
64
-
65
-
66
-
67
-
68
-
69
-
70
-
71
-
72
-
73
-
74
-
75
-
76
-
77
-
78
-
79
-
80
-
81
-
82
-
83
-
84
-
85
-
86
-
87
-
88
-
89
-
90
-
91
-
92
-
93
-
94
-
95
-
96
-
97
-
98
-
99
-
100
-
101
-
102
-
103
-
104
-
105
-
106
-
107
-
108
-
109
-
110
-
111
-
112
-
113
-
114
-
115
-
116
-
117
-
118
-
119
-
120
-
121
-
122
-
123
-
124
-
125
-
126
-
127
-
128
-
129
-
130
-
131
-
132
-
133
-
134
-
135
-
136
-
137
-
138
-
139
-
140
-
141
-
142
-
143
-
144
-
145
-
146
-
147
-
148
-
149
-
150
-
151
-
152
-
153
-
154
-
155
-
156
-
157
-
158
-
159
-
160
-
161
-
162
-
163
-
 164
164 -
 165
165 -
 166
166 -
 167
167 -
 168
168 -
 169
169 -
 170
170 -
 171
171 -
 172
172 -
 173
173 -
 174
174 -
 175
175 -
 176
176 -
 177
177 -
 178
178 -
 179
179 -
 180
180 -
 181
181 -
 182
182 -
 183
183 -
 184
184 -
185
-
186
-
187
-
188
-
189
-
190
-
191
-
192
-
193
-
194
-
195
-
196
-
197
-
198
-
199
-
200
-
201
-
202
-
203
-
204
-
205
-
206
-
207
-
208
-
209
-
210
-
211
-
212
-
213
-
214
-
215
-
216
-
217
-
218
-
219
-
220
-
221
-
222
-
223
-
224
-
225
-
226
-
227
-
228
-
229
-
230
-
231
-
232
-
233
-
234
-
235
-
236
-
237
-
238
-
239
-
240
-
241
-
242
-
243
-
244
-
245
-
246
-
247
-
248
-
249
-
250
-
251
-
252
-
253
-
254
-
255
-
256
-
257
-
258
-
259
-
260
-
261
-
262
-
263
-
264
-
265
-
266
-
267
-
268
-
269
-
270
-
271
-
272
-
273
-
274
-
275
-
276
 |
 |

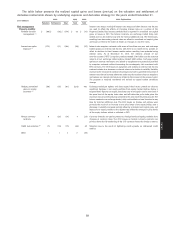
MARKET RISK
Market risk is the risk that we will incur losses due to adverse changes in interest rates, credit spreads, equity
prices, commodity prices, or currency exchange rates. Adverse changes to these rates and prices may occur due to
changes in the liquidity of a market or market segment, insolvency or financial distress of key market makers or
participants or changes in market perceptions of credit worthiness and/or risk tolerance. Our primary market risk
exposures are to changes in interest rates, credit spreads and equity prices.
The active management of market risk is integral to our results of operations. We may use the following approaches
to manage exposure to market risk within defined tolerance ranges: 1) rebalancing existing asset or liability portfolios,
2) changing the character of investments purchased in the future and 3) using derivative instruments to modify the
market risk characteristics of existing assets and liabilities or assets expected to be purchased. For a more detailed
discussion of our use of derivative financial instruments, see Note 6 of the consolidated financial statements.
Overview In formulating and implementing guidelines for investing funds, we seek to earn returns that enhance
our ability to offer competitive rates and prices to customers while contributing to attractive and stable profits and
long-term capital growth. Accordingly, our investment decisions and objectives are a function of the underlying risks
and product profiles of each business.
Investment policies define the overall framework for managing market and other investment risks, including
accountability and controls over risk management activities. Subsidiaries that conduct investment activities follow
policies that have been approved by their respective boards of directors. These investment policies specify the
investment limits and strategies that are appropriate given the liquidity, surplus, product profile and regulatory
requirements of the subsidiary. Executive oversight of investment activities is conducted primarily through subsidiaries’
boards of directors and investment committees. For Allstate Financial, its asset-liability management (‘‘ALM’’) policies
further define the overall framework for managing market and investment risks. ALM focuses on strategies to enhance
yields, mitigate market risks and optimize capital to improve profitability and returns for Allstate Financial. Allstate
Financial ALM activities follow asset-liability policies that have been approved by their respective boards of directors.
These ALM policies specify limits, ranges and/or targets for investments that best meet Allstate Financial’s business
objectives in light of its product liabilities.
We manage our exposure to market risk through the use of asset allocation, duration, simulation, and as
appropriate, through the use of stress tests. We have asset allocation limits that place restrictions on the total funds that
may be invested within an asset class. We have duration limits on the Property-Liability and Allstate Financial
investment portfolios and, as appropriate, on individual components of these portfolios. These duration limits place
restrictions on the amount of interest rate risk that may be taken. Comprehensive day-to-day management of market
risk within defined tolerance ranges occurs as portfolio managers buy and sell within their respective markets based
upon the acceptable boundaries established by investment policies. For Allstate Financial, this day-to-day management
is integrated with and informed by the activities of the ALM organization. This integration is intended to result in a
prudent, methodical and effective adjudication of market risk and return, conditioned by the unique demands and
dynamics of Allstate Financial’s product liabilities and supported by the continuous application of advanced risk
technology and analytics.
Although we apply a similar overall philosophy to market risk, the underlying business frameworks and the
accounting and regulatory environments differ considerably between the Property-Liability and Allstate Financial
businesses affecting investment decisions and risk parameters.
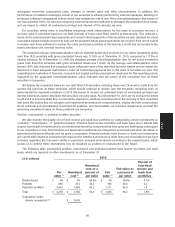
Interest rate risk is the risk that we will incur a loss due to adverse changes in interest rates relative to the interest
rate characteristics of our interest bearing assets and liabilities. This risk arises from many of our primary activities, as
we invest substantial funds in interest-sensitive assets and issue interest-sensitive liabilities. Interest rate risk includes
risks related to changes in U.S. Treasury yields and other key risk-free reference yields.
We manage the interest rate risk in our assets relative to the interest rate risk in our liabilities. One of the measures
used to quantify this exposure is duration. Duration measures the price sensitivity of the assets and liabilities to changes
in interest rates. For example, if interest rates increase 100 basis points, the fair value of an asset with a duration of 5 is
expected to decrease in value by 5%. As of December 31, 2010, the difference between our asset and liability duration
was (0.64) gap, compared to a (0.24) gap as of December 31, 2009. A negative duration gap indicates that the fair value
of our liabilities is more sensitive to interest rate movements than the fair value of our assets. The Property-Liability
segment generally maintains a positive duration gap between its assets and liabilities due to the relatively short duration
of auto and homeowners claims, which are its primary liabilities. The Allstate Financial segment may have a positive or
94
MD&A