Allstate 2011 Annual Report Download - page 152
Download and view the complete annual report
Please find page 152 of the 2011 Allstate annual report below. You can navigate through the pages in the report by either clicking on the pages listed below, or by using the keyword search tool below to find specific information within the annual report.-
 1
1 -
2
-
3
-
4
-
5
-
6
-
7
-
8
-
9
-
10
-
11
-
12
-
13
-
14
-
15
-
16
-
17
-
18
-
19
-
20
-
21
-
22
-
23
-
24
-
25
-
26
-
27
-
28
-
29
-
30
-
31
-
32
-
33
-
34
-
35
-
36
-
37
-
38
-
39
-
40
-
41
-
42
-
43
-
44
-
45
-
46
-
47
-
48
-
49
-
50
-
51
-
52
-
53
-
54
-
55
-
56
-
57
-
58
-
59
-
60
-
61
-
62
-
63
-
64
-
65
-
66
-
67
-
68
-
69
-
70
-
71
-
72
-
73
-
74
-
75
-
76
-
77
-
78
-
79
-
80
-
81
-
82
-
83
-
84
-
85
-
86
-
87
-
88
-
89
-
90
-
91
-
92
-
93
-
94
-
95
-
96
-
97
-
98
-
99
-
100
-
101
-
102
-
103
-
104
-
105
-
106
-
107
-
108
-
109
-
110
-
111
-
112
-
113
-
114
-
115
-
116
-
117
-
118
-
119
-
120
-
121
-
122
-
123
-
124
-
125
-
126
-
127
-
128
-
129
-
130
-
131
-
132
-
133
-
134
-
135
-
136
-
137
-
138
-
139
-
140
-
141
-
 142
142 -
 143
143 -
 144
144 -
 145
145 -
 146
146 -
 147
147 -
 148
148 -
 149
149 -
 150
150 -
 151
151 -
 152
152 -
 153
153 -
 154
154 -
 155
155 -
 156
156 -
 157
157 -
 158
158 -
 159
159 -
 160
160 -
 161
161 -
 162
162 -
163
-
164
-
165
-
166
-
167
-
168
-
169
-
170
-
171
-
172
-
173
-
174
-
175
-
176
-
177
-
178
-
179
-
180
-
181
-
182
-
183
-
184
-
185
-
186
-
187
-
188
-
189
-
190
-
191
-
192
-
193
-
194
-
195
-
196
-
197
-
198
-
199
-
200
-
201
-
202
-
203
-
204
-
205
-
206
-
207
-
208
-
209
-
210
-
211
-
212
-
213
-
214
-
215
-
216
-
217
-
218
-
219
-
220
-
221
-
222
-
223
-
224
-
225
-
226
-
227
-
228
-
229
-
230
-
231
-
232
-
233
-
234
-
235
-
236
-
237
-
238
-
239
-
240
-
241
-
242
-
243
-
244
-
245
-
246
-
247
-
248
-
249
-
250
-
251
-
252
-
253
-
254
-
255
-
256
-
257
-
258
-
259
-
260
-
261
-
262
-
263
-
264
-
265
-
266
-
267
-
268
-
269
-
270
-
271
-
272
-
273
-
274
-
275
-
276
 |
 |

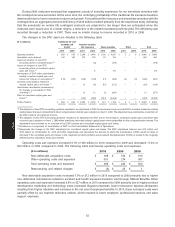
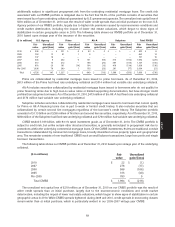
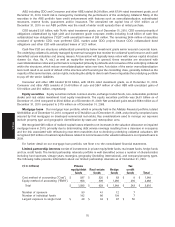
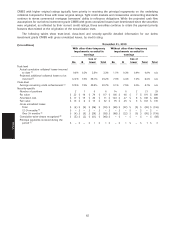
improvement for equity securities was primarily due to improved equity valuations. The following table presents
unrealized net capital gains and losses, pre-tax and after-tax as of December 31.
($ in millions) 2010 2009
U.S. government and agencies $ 276 $ 203
Municipal (267) (403)
Corporate 1,395 345
Foreign government 337 291
RMBS (516) (1,500)
CMBS (219) (925)
ABS (181) (488)
Redeemable preferred stock 1 —
Fixed income securities (1) 826 (2,477)
Equity securities 583 179
Derivatives (22) (23)
Unrealized net capital gains and losses, pre-tax 1,387 (2,321)
Amounts recognized for:
Insurance reserves (2) (41) —
DAC and DSI (3) 97 990
Amounts recognized 56 990
Deferred income taxes (508) 461
Unrealized net capital gains and losses, after-tax $ 935 $ (870)
(1) Unrealized net capital gains and losses for fixed income securities as of December 31, 2010 and 2009 comprise
$(293) million and $(679) million, respectively, related to unrealized net capital losses on fixed income securities with
other-than-temporary impairment and $1.12 billion and $(1.80) billion, respectively, related to other unrealized net
capital gains and losses.
(2) The insurance reserves adjustment represents the amount by which the reserve balance would increase if the net
unrealized gains in the applicable product portfolios were realized and reinvested at current lower interest rates,
resulting in a premium deficiency. Although we evaluate premium deficiencies on the combined performance of our
life insurance and immediate annuities with life contingencies, the adjustment primarily relates to structured
settlement annuities with life contingencies, in addition to annuity buy-outs and certain payout annuities with life
contingencies.
(3) The DAC and DSI adjustment balance represents the amount by which the amortization of DAC and DSI would
increase or decrease if the unrealized gains or losses in the respective product portfolios were realized. Only the
unrealized net capital gains and losses on the Allstate Financial fixed annuity and interest-sensitive life product
portfolios are used in this calculation. The DAC and DSI adjustment balance, subject to limitations, is determined by
applying the DAC and DSI amortization rate to unrealized net capital gains or losses. Recapitalization of the DAC and
DSI balances is limited to the originally deferred costs plus interest.
The unrealized net capital gains for the fixed income portfolio totaled $826 million and comprised $3.26 billion of
gross unrealized gains and $2.43 billion of gross unrealized losses as of December 31, 2010. This is compared to
unrealized net capital losses for the fixed income portfolio totaling $2.48 billion, comprised of $2.47 billion of gross
unrealized gains and $4.95 billion of gross unrealized losses as of December 31, 2009.
72
MD&A