Allstate 2011 Annual Report Download - page 127
Download and view the complete annual report
Please find page 127 of the 2011 Allstate annual report below. You can navigate through the pages in the report by either clicking on the pages listed below, or by using the keyword search tool below to find specific information within the annual report.-
 1
1 -
2
-
3
-
4
-
5
-
6
-
7
-
8
-
9
-
10
-
11
-
12
-
13
-
14
-
15
-
16
-
17
-
18
-
19
-
20
-
21
-
22
-
23
-
24
-
25
-
26
-
27
-
28
-
29
-
30
-
31
-
32
-
33
-
34
-
35
-
36
-
37
-
38
-
39
-
40
-
41
-
42
-
43
-
44
-
45
-
46
-
47
-
48
-
49
-
50
-
51
-
52
-
53
-
54
-
55
-
56
-
57
-
58
-
59
-
60
-
61
-
62
-
63
-
64
-
65
-
66
-
67
-
68
-
69
-
70
-
71
-
72
-
73
-
74
-
75
-
76
-
77
-
78
-
79
-
80
-
81
-
82
-
83
-
84
-
85
-
86
-
87
-
88
-
89
-
90
-
91
-
92
-
93
-
94
-
95
-
96
-
97
-
98
-
99
-
100
-
101
-
102
-
103
-
104
-
105
-
106
-
107
-
108
-
109
-
110
-
111
-
112
-
113
-
114
-
115
-
116
-
 117
117 -
 118
118 -
 119
119 -
 120
120 -
 121
121 -
 122
122 -
 123
123 -
 124
124 -
 125
125 -
 126
126 -
 127
127 -
 128
128 -
 129
129 -
 130
130 -
 131
131 -
 132
132 -
 133
133 -
 134
134 -
 135
135 -
 136
136 -
 137
137 -
138
-
139
-
140
-
141
-
142
-
143
-
144
-
145
-
146
-
147
-
148
-
149
-
150
-
151
-
152
-
153
-
154
-
155
-
156
-
157
-
158
-
159
-
160
-
161
-
162
-
163
-
164
-
165
-
166
-
167
-
168
-
169
-
170
-
171
-
172
-
173
-
174
-
175
-
176
-
177
-
178
-
179
-
180
-
181
-
182
-
183
-
184
-
185
-
186
-
187
-
188
-
189
-
190
-
191
-
192
-
193
-
194
-
195
-
196
-
197
-
198
-
199
-
200
-
201
-
202
-
203
-
204
-
205
-
206
-
207
-
208
-
209
-
210
-
211
-
212
-
213
-
214
-
215
-
216
-
217
-
218
-
219
-
220
-
221
-
222
-
223
-
224
-
225
-
226
-
227
-
228
-
229
-
230
-
231
-
232
-
233
-
234
-
235
-
236
-
237
-
238
-
239
-
240
-
241
-
242
-
243
-
244
-
245
-
246
-
247
-
248
-
249
-
250
-
251
-
252
-
253
-
254
-
255
-
256
-
257
-
258
-
259
-
260
-
261
-
262
-
263
-
264
-
265
-
266
-
267
-
268
-
269
-
270
-
271
-
272
-
273
-
274
-
275
-
276
 |
 |

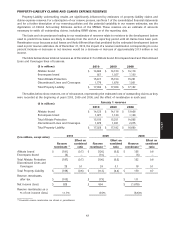
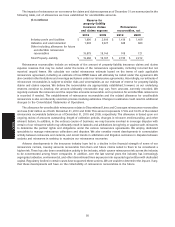
Reserve reestimates for the Discontinued Lines and Coverages, as shown in the table below, were increased
primarily for environmental in 2010 and other discontinued lines in both 2009 and 2008.
2010 2009 2008
($ in millions)
January 1 Reserve January 1 Reserve January 1 Reserve
reserves reestimate reserves reestimate reserves reestimate
Asbestos Claims $ 1,180 $ 5 $ 1,228 $ (8) $ 1,302 $ 8
Environmental Claims 198 18 195 13 232 —
Other Discontinued Lines 500 5 508 19 541 10
Total Discontinued Lines and
coverages $ 1,878 $ 28 $ 1,931 $ 24 $ 2,075 $ 18
Underwriting loss $ (31) $ (32) $ (25)
Reserve reestimates as a % of
underwriting loss (90.3)% (75.0)% (72.0)%
Reserve additions for asbestos in 2010 totaling $5 million were primarily for products related coverage. Asbestos
reserves reestimates in 2009 were $8 million favorable. Reserve additions for asbestos in 2008 totaling $8 million were
primarily for products-related coverage and were a result of a continuing level of increased claim activity being reported
by excess and primary insurance policyholders with existing active claims, excess policyholders with new claims, and
reestimates of liabilities for increased assumed reinsurance cessions, as ceding companies (other insurance carriers)
also experienced increased claim activity. Higher claim activity over prior estimates has also resulted in an increased
estimate for future claims reported. These trends are consistent with the trends of other carriers in the industry, which
we believe are related to increased publicity and awareness of coverage, ongoing litigation and bankruptcy actions.
The reserve additions for environmental in 2010 and 2009 were primarily related to site-specific remediations where
the clean-up cost estimates and responsibility for the clean-up were more fully determined. Normal environmental
claim activity resulted in essentially no change in estimated reserves for 2008. IBNR now represents 62% of total net
environmental reserves, 3 points lower than as of December 31, 2009.
47
MD&A