Allstate 2011 Annual Report Download - page 166
Download and view the complete annual report
Please find page 166 of the 2011 Allstate annual report below. You can navigate through the pages in the report by either clicking on the pages listed below, or by using the keyword search tool below to find specific information within the annual report.-
 1
1 -
2
-
3
-
4
-
5
-
6
-
7
-
8
-
9
-
10
-
11
-
12
-
13
-
14
-
15
-
16
-
17
-
18
-
19
-
20
-
21
-
22
-
23
-
24
-
25
-
26
-
27
-
28
-
29
-
30
-
31
-
32
-
33
-
34
-
35
-
36
-
37
-
38
-
39
-
40
-
41
-
42
-
43
-
44
-
45
-
46
-
47
-
48
-
49
-
50
-
51
-
52
-
53
-
54
-
55
-
56
-
57
-
58
-
59
-
60
-
61
-
62
-
63
-
64
-
65
-
66
-
67
-
68
-
69
-
70
-
71
-
72
-
73
-
74
-
75
-
76
-
77
-
78
-
79
-
80
-
81
-
82
-
83
-
84
-
85
-
86
-
87
-
88
-
89
-
90
-
91
-
92
-
93
-
94
-
95
-
96
-
97
-
98
-
99
-
100
-
101
-
102
-
103
-
104
-
105
-
106
-
107
-
108
-
109
-
110
-
111
-
112
-
113
-
114
-
115
-
116
-
117
-
118
-
119
-
120
-
121
-
122
-
123
-
124
-
125
-
126
-
127
-
128
-
129
-
130
-
131
-
132
-
133
-
134
-
135
-
136
-
137
-
138
-
139
-
140
-
141
-
142
-
143
-
144
-
145
-
146
-
147
-
148
-
149
-
150
-
151
-
152
-
153
-
154
-
155
-
 156
156 -
 157
157 -
 158
158 -
 159
159 -
 160
160 -
 161
161 -
 162
162 -
 163
163 -
 164
164 -
 165
165 -
 166
166 -
 167
167 -
 168
168 -
 169
169 -
 170
170 -
 171
171 -
 172
172 -
 173
173 -
 174
174 -
 175
175 -
 176
176 -
177
-
178
-
179
-
180
-
181
-
182
-
183
-
184
-
185
-
186
-
187
-
188
-
189
-
190
-
191
-
192
-
193
-
194
-
195
-
196
-
197
-
198
-
199
-
200
-
201
-
202
-
203
-
204
-
205
-
206
-
207
-
208
-
209
-
210
-
211
-
212
-
213
-
214
-
215
-
216
-
217
-
218
-
219
-
220
-
221
-
222
-
223
-
224
-
225
-
226
-
227
-
228
-
229
-
230
-
231
-
232
-
233
-
234
-
235
-
236
-
237
-
238
-
239
-
240
-
241
-
242
-
243
-
244
-
245
-
246
-
247
-
248
-
249
-
250
-
251
-
252
-
253
-
254
-
255
-
256
-
257
-
258
-
259
-
260
-
261
-
262
-
263
-
264
-
265
-
266
-
267
-
268
-
269
-
270
-
271
-
272
-
273
-
274
-
275
-
276
 |
 |

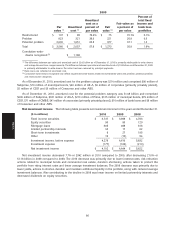
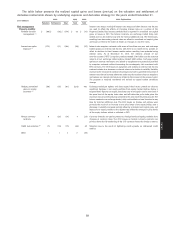
2009
Percent of
Amortized total fixed
cost as a Fair value as income and
Par Amortized percent of Fair a percent of bank loan
value (1) cost (1) par value value (2) par value portfolios
Restructured $ 107 $ 85 79.4% $ 75 70.1% 0.1%
Problem 823 321 39.0 221 26.9 0.3
Potential problem 2,630 1,651 62.8 977 37.1 1.2
Total $ 3,560 $ 2,057 57.8 $ 1,273 35.8 1.6%
Cumulative write-
downs recognized (3) $ 1,188
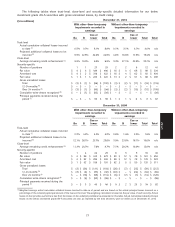
(1) The difference between par value and amortized cost of $2.42 billion as of December 31, 2010 is primarily attributable to write-downs
and a deep discount zero-coupon security. The difference between par value and amortized cost of $1.50 billion as of December 31, 2009
is primarily attributable to write-downs. Par value has been reduced by principal payments.
(2) Bank loans are reflected at amortized cost.
(3) Cumulative write-downs recognized only reflect impairment write-downs related to investments within the problem, potential problem
and restructured categories.
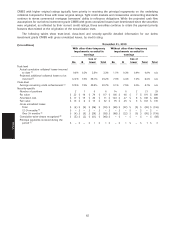
As of December 31, 2010, amortized cost for the problem category was $214 million and comprised $90 million of
Subprime, $70 million of municipal bonds, $40 million of Alt-A, $6 million of corporates (primarily privately placed),
$5 million of CDO and $3 million of Consumer and other ABS.
As of December 31, 2010, amortized cost for the potential problem category was $1.49 billion and comprised
$606 million of Subprime, $331 million of Alt-A, $213 million of Prime, $125 million of municipal bonds, $79 million of
CDO, $71 million of CMBS, $41 million of corporates (primarily privately placed), $10 million of bank loans and $9 million
of Consumer and other ABS.
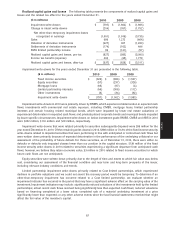
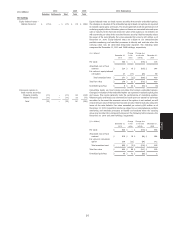
Net investment income The following table presents net investment income for the years ended December 31.
($ in millions) 2010 2009 2008
Fixed income securities $ 3,737 $ 3,998 $ 4,783
Equity securities 90 80 120
Mortgage loans 385 498 618
Limited partnership interests 40 17 62
Short-term investments 8 27 195
Other 19 (10) 54
Investment income, before expense 4,279 4,610 5,832
Investment expense (177) (166) (210)
Net investment income $ 4,102 $ 4,444 $ 5,622
Net investment income decreased 7.7% or $342 million in 2010 compared to 2009, after decreasing 21.0% or
$1.18 billion in 2009 compared to 2008. The 2010 decrease was primarily due to lower interest rates, risk reduction
actions related to municipal bonds and commercial real estate, duration shortening actions taken to protect the
portfolio from rising interest rates and lower average investment balances. The 2009 decrease was primarily due to
lower yields, actions to shorten duration and maintain additional liquidity in the portfolio, along with reduced average
investment balances. Also contributing to the decline in 2009 was lower income on limited partnership interests and
decreased dividends on equity securities.
86
MD&A