Allstate 2011 Annual Report Download - page 140
Download and view the complete annual report
Please find page 140 of the 2011 Allstate annual report below. You can navigate through the pages in the report by either clicking on the pages listed below, or by using the keyword search tool below to find specific information within the annual report.-
 1
1 -
2
-
3
-
4
-
5
-
6
-
7
-
8
-
9
-
10
-
11
-
12
-
13
-
14
-
15
-
16
-
17
-
18
-
19
-
20
-
21
-
22
-
23
-
24
-
25
-
26
-
27
-
28
-
29
-
30
-
31
-
32
-
33
-
34
-
35
-
36
-
37
-
38
-
39
-
40
-
41
-
42
-
43
-
44
-
45
-
46
-
47
-
48
-
49
-
50
-
51
-
52
-
53
-
54
-
55
-
56
-
57
-
58
-
59
-
60
-
61
-
62
-
63
-
64
-
65
-
66
-
67
-
68
-
69
-
70
-
71
-
72
-
73
-
74
-
75
-
76
-
77
-
78
-
79
-
80
-
81
-
82
-
83
-
84
-
85
-
86
-
87
-
88
-
89
-
90
-
91
-
92
-
93
-
94
-
95
-
96
-
97
-
98
-
99
-
100
-
101
-
102
-
103
-
104
-
105
-
106
-
107
-
108
-
109
-
110
-
111
-
112
-
113
-
114
-
115
-
116
-
117
-
118
-
119
-
120
-
121
-
122
-
123
-
124
-
125
-
126
-
127
-
128
-
129
-
 130
130 -
 131
131 -
 132
132 -
 133
133 -
 134
134 -
 135
135 -
 136
136 -
 137
137 -
 138
138 -
 139
139 -
 140
140 -
 141
141 -
 142
142 -
 143
143 -
 144
144 -
 145
145 -
 146
146 -
 147
147 -
 148
148 -
 149
149 -
 150
150 -
151
-
152
-
153
-
154
-
155
-
156
-
157
-
158
-
159
-
160
-
161
-
162
-
163
-
164
-
165
-
166
-
167
-
168
-
169
-
170
-
171
-
172
-
173
-
174
-
175
-
176
-
177
-
178
-
179
-
180
-
181
-
182
-
183
-
184
-
185
-
186
-
187
-
188
-
189
-
190
-
191
-
192
-
193
-
194
-
195
-
196
-
197
-
198
-
199
-
200
-
201
-
202
-
203
-
204
-
205
-
206
-
207
-
208
-
209
-
210
-
211
-
212
-
213
-
214
-
215
-
216
-
217
-
218
-
219
-
220
-
221
-
222
-
223
-
224
-
225
-
226
-
227
-
228
-
229
-
230
-
231
-
232
-
233
-
234
-
235
-
236
-
237
-
238
-
239
-
240
-
241
-
242
-
243
-
244
-
245
-
246
-
247
-
248
-
249
-
250
-
251
-
252
-
253
-
254
-
255
-
256
-
257
-
258
-
259
-
260
-
261
-
262
-
263
-
264
-
265
-
266
-
267
-
268
-
269
-
270
-
271
-
272
-
273
-
274
-
275
-
276
 |
 |

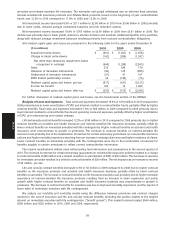
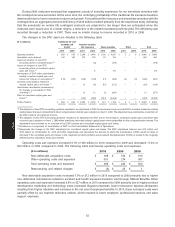
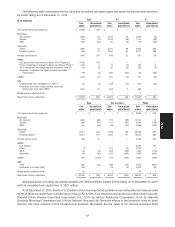
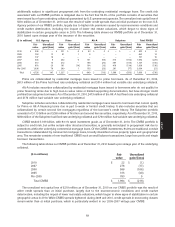
To further analyze investment spreads, the following table summarizes the weighted average investment yield on
assets supporting product liabilities and capital, interest crediting rates and investment spreads for 2010, 2009 and
2008.
Weighted average
Weighted average interest crediting Weighted average
investment yield rate investment spreads
2010 2009 2008 2010 2009 2008 2010 2009 2008
Interest-sensitive life insurance 5.5% 5.5% 6.0% 4.4% 4.6% 4.6% 1.1% 0.9% 1.4%
Deferred fixed annuities and institutional
products 4.4 4.5 5.2 3.2 3.4 3.7 1.2 1.1 1.5
Immediate fixed annuities with and without
life contingencies 6.4 6.3 6.8 6.4 6.5 6.5 — (0.2) 0.3
Investments supporting capital, traditional
life and other products 3.7 3.7 5.3 n/a n/a n/a n/a n/a n/a
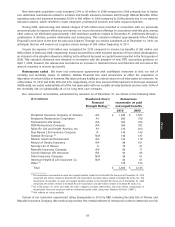
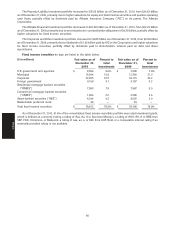
The following table summarizes our product liabilities as of December 31 and indicates the account value of those
contracts and policies in which an investment spread is generated.
($ in millions) 2010 2009 2008
Immediate fixed annuities with life contingencies $ 8,696 $ 8,454 $ 8,355
Other life contingent contracts and other 4,786 4,456 4,526
Reserve for life-contingent contract benefits $ 13,482 $ 12,910 $ 12,881
Interest-sensitive life insurance $ 10,675 $ 10,276 $ 9,957
Deferred fixed annuities 29,367 32,194 33,766
Immediate fixed annuities without life contingencies 3,799 3,869 3,894
Institutional products 2,650 4,370 8,974
Allstate Bank products 1,091 1,085 949
Market value adjustments related to fair value hedges and other 613 788 873
Contractholder funds $ 48,195 $ 52,582 $ 58,413
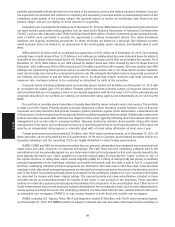
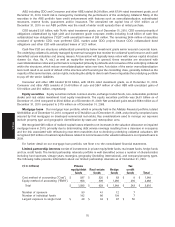
The following table summarizes the weighted average guaranteed crediting rates and weighted average current
crediting rates for certain fixed annuities and interest-sensitive life contracts where management has the ability to
change the crediting rate, subject to a contractual minimum. Other products, including equity-indexed, variable and
immediate annuities, equity-indexed and variable life, institutional products and Allstate Bank products totaling
$13.74 billion of contractholder funds, have been excluded from the analysis because management does not have the
ability to change the crediting rate or the minimum crediting rate is not considering meaningful in this context.
As of December 31, 2010
($ in millions)
Weighted Weighted
average average
guaranteed current
crediting crediting Contractholder
rates rates funds
Annuities with annual crediting rate resets 3.06% 3.08% $ 12,718
Annuities with multi-year rate guarantees: (1)
Resetable in next 12 months 1.62 4.37 2,597
Resetable after 12 months 1.76 3.98 8,503
Interest-sensitive life 3.99 4.46 10,637
(1) These contracts include interest rate guarantee periods which are typically 5 or 6 years.
60
MD&A