Allstate 2011 Annual Report Download - page 171
Download and view the complete annual report
Please find page 171 of the 2011 Allstate annual report below. You can navigate through the pages in the report by either clicking on the pages listed below, or by using the keyword search tool below to find specific information within the annual report.-
 1
1 -
2
-
3
-
4
-
5
-
6
-
7
-
8
-
9
-
10
-
11
-
12
-
13
-
14
-
15
-
16
-
17
-
18
-
19
-
20
-
21
-
22
-
23
-
24
-
25
-
26
-
27
-
28
-
29
-
30
-
31
-
32
-
33
-
34
-
35
-
36
-
37
-
38
-
39
-
40
-
41
-
42
-
43
-
44
-
45
-
46
-
47
-
48
-
49
-
50
-
51
-
52
-
53
-
54
-
55
-
56
-
57
-
58
-
59
-
60
-
61
-
62
-
63
-
64
-
65
-
66
-
67
-
68
-
69
-
70
-
71
-
72
-
73
-
74
-
75
-
76
-
77
-
78
-
79
-
80
-
81
-
82
-
83
-
84
-
85
-
86
-
87
-
88
-
89
-
90
-
91
-
92
-
93
-
94
-
95
-
96
-
97
-
98
-
99
-
100
-
101
-
102
-
103
-
104
-
105
-
106
-
107
-
108
-
109
-
110
-
111
-
112
-
113
-
114
-
115
-
116
-
117
-
118
-
119
-
120
-
121
-
122
-
123
-
124
-
125
-
126
-
127
-
128
-
129
-
130
-
131
-
132
-
133
-
134
-
135
-
136
-
137
-
138
-
139
-
140
-
141
-
142
-
143
-
144
-
145
-
146
-
147
-
148
-
149
-
150
-
151
-
152
-
153
-
154
-
155
-
156
-
157
-
158
-
159
-
160
-
 161
161 -
 162
162 -
 163
163 -
 164
164 -
 165
165 -
 166
166 -
 167
167 -
 168
168 -
 169
169 -
 170
170 -
 171
171 -
 172
172 -
 173
173 -
 174
174 -
 175
175 -
 176
176 -
 177
177 -
 178
178 -
 179
179 -
 180
180 -
 181
181 -
182
-
183
-
184
-
185
-
186
-
187
-
188
-
189
-
190
-
191
-
192
-
193
-
194
-
195
-
196
-
197
-
198
-
199
-
200
-
201
-
202
-
203
-
204
-
205
-
206
-
207
-
208
-
209
-
210
-
211
-
212
-
213
-
214
-
215
-
216
-
217
-
218
-
219
-
220
-
221
-
222
-
223
-
224
-
225
-
226
-
227
-
228
-
229
-
230
-
231
-
232
-
233
-
234
-
235
-
236
-
237
-
238
-
239
-
240
-
241
-
242
-
243
-
244
-
245
-
246
-
247
-
248
-
249
-
250
-
251
-
252
-
253
-
254
-
255
-
256
-
257
-
258
-
259
-
260
-
261
-
262
-
263
-
264
-
265
-
266
-
267
-
268
-
269
-
270
-
271
-
272
-
273
-
274
-
275
-
276
 |
 |

2010 2009 2008 2010 Explanations
($ in millions)
Valuation Settlements Total Total Total
Accounting
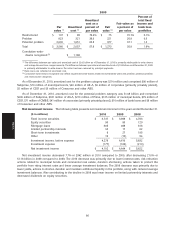
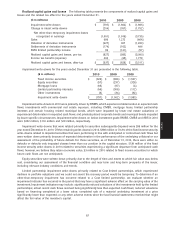
Equity indexed notes — Equity-indexed notes are fixed income securities that contain embedded options.
Allstate Financial $ (17) $ — $ (17) $ 28 $ (290) The changes in valuation of the embedded equity indexed call options are reported
in realized capital gains and losses. The results generally track the performance of
underlying equity indices. Valuation gains and losses are converted into cash upon
sale or maturity. In the event the economic value of the options is not realized, we
will recover the par value of the host fixed income security if held to maturity unless
the issuer of the note defaults. Par value exceeded fair value by $21 million as of
December 31, 2010. Equity-indexed notes are subject to our comprehensive
portfolio monitoring and watchlist processes to identify and evaluate when the
carrying value may be other-than-temporarily impaired. The following table
compares the December 31, 2010 and 2009 holdings, respectively.
($ in millions) Change Change due
December 31, in fair to net sale December 31,
2010 value activity 2009
Par value $ 300 $ — $ (175) $ 475
Amortized cost of host
contract $ 224 $ 15 $ (135) $ 344
Fair value of equity-indexed
call option 47 (17) (25) 89
Total amortized cost $ 271 $ (2) $ (160) $ 433
Total fair value $ 279 $ 22 $ (173) $ 430
Unrealized gain/loss $ 8 $ 24 $ (13) $ (3)
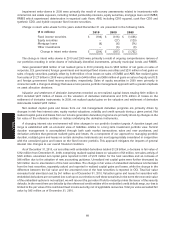
Conversion options in Convertible bonds are fixed income securities that contain embedded options.
fixed income securities Changes in valuation of the embedded option are reported in realized capital gains
Property–Liability (11) — (11) 60 (143) and losses. The results generally track the performance of underlying equities.
Allstate Financial (11) — (11) 32 (77) Valuation gains and losses are converted into cash upon our election to sell these
securities. In the event the economic value of the options is not realized, we will
Total (22) — (22) 92 (220) recover the par value of the host fixed income security if held to maturity unless the
issuer of the note defaults. Fair value exceeded par value by $80 million as of
December 31, 2010. Convertible bonds are subject to our comprehensive portfolio
monitoring and watchlist processes to identify and evaluate when the carrying
value may be other-than-temporarily impaired. The following table compares the
December 31, 2010 and 2009 holdings, respectively.
($ in millions) Change Change due
December 31, in fair to net sale December 31,
2010 value activity 2009
Par value $ 820 $ — $ (116) $ 936
Amortized cost of host
contract $ 619 $ 19 $ (64) $ 664
Fair value of conversion
option 236 (22) (54) 312
Total amortized cost $ 855 $ (3) $ (118) $ 976
Total fair value $ 900 $ 69 $ (147) $ 978
Unrealized gain/loss $ 45 $ 72 $ (29) $ 2
91
MD&A