Allstate 2011 Annual Report Download - page 129
Download and view the complete annual report
Please find page 129 of the 2011 Allstate annual report below. You can navigate through the pages in the report by either clicking on the pages listed below, or by using the keyword search tool below to find specific information within the annual report.-
 1
1 -
2
-
3
-
4
-
5
-
6
-
7
-
8
-
9
-
10
-
11
-
12
-
13
-
14
-
15
-
16
-
17
-
18
-
19
-
20
-
21
-
22
-
23
-
24
-
25
-
26
-
27
-
28
-
29
-
30
-
31
-
32
-
33
-
34
-
35
-
36
-
37
-
38
-
39
-
40
-
41
-
42
-
43
-
44
-
45
-
46
-
47
-
48
-
49
-
50
-
51
-
52
-
53
-
54
-
55
-
56
-
57
-
58
-
59
-
60
-
61
-
62
-
63
-
64
-
65
-
66
-
67
-
68
-
69
-
70
-
71
-
72
-
73
-
74
-
75
-
76
-
77
-
78
-
79
-
80
-
81
-
82
-
83
-
84
-
85
-
86
-
87
-
88
-
89
-
90
-
91
-
92
-
93
-
94
-
95
-
96
-
97
-
98
-
99
-
100
-
101
-
102
-
103
-
104
-
105
-
106
-
107
-
108
-
109
-
110
-
111
-
112
-
113
-
114
-
115
-
116
-
117
-
118
-
 119
119 -
 120
120 -
 121
121 -
 122
122 -
 123
123 -
 124
124 -
 125
125 -
 126
126 -
 127
127 -
 128
128 -
 129
129 -
 130
130 -
 131
131 -
 132
132 -
 133
133 -
 134
134 -
 135
135 -
 136
136 -
 137
137 -
 138
138 -
 139
139 -
140
-
141
-
142
-
143
-
144
-
145
-
146
-
147
-
148
-
149
-
150
-
151
-
152
-
153
-
154
-
155
-
156
-
157
-
158
-
159
-
160
-
161
-
162
-
163
-
164
-
165
-
166
-
167
-
168
-
169
-
170
-
171
-
172
-
173
-
174
-
175
-
176
-
177
-
178
-
179
-
180
-
181
-
182
-
183
-
184
-
185
-
186
-
187
-
188
-
189
-
190
-
191
-
192
-
193
-
194
-
195
-
196
-
197
-
198
-
199
-
200
-
201
-
202
-
203
-
204
-
205
-
206
-
207
-
208
-
209
-
210
-
211
-
212
-
213
-
214
-
215
-
216
-
217
-
218
-
219
-
220
-
221
-
222
-
223
-
224
-
225
-
226
-
227
-
228
-
229
-
230
-
231
-
232
-
233
-
234
-
235
-
236
-
237
-
238
-
239
-
240
-
241
-
242
-
243
-
244
-
245
-
246
-
247
-
248
-
249
-
250
-
251
-
252
-
253
-
254
-
255
-
256
-
257
-
258
-
259
-
260
-
261
-
262
-
263
-
264
-
265
-
266
-
267
-
268
-
269
-
270
-
271
-
272
-
273
-
274
-
275
-
276
 |
 |

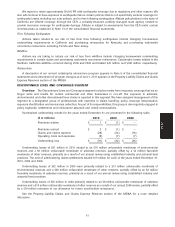
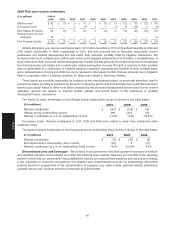
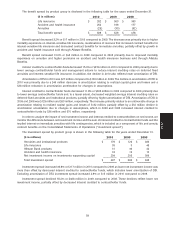
Our net asbestos reserves by type of exposure and total reserve additions are shown in the following table.
December 31, 2010 December 31, 2009 December 31, 2008
($ in millions)
Active Active Active
policy- Net % of policy- Net % of policy- Net % of
holders reserves reserves holders reserves reserves holders reserves reserves
Direct policyholders:
–Primary 51 $ 17 1% 51 $ 19 1% 54 $ 21 2%
–Excess 319 261 24 318 256 22 330 216 17
Total 370 278 25 369 275 23 384 237 19
Assumed reinsurance 165 15 176 15 205 17
IBNR 657 60 729 62 786 64
Total net reserves $ 1,100 100% $ 1,180 100% $ 1,228 100%
Total reserve additions $ 5 $ (8) $ 8
During the last three years, 56 direct primary and excess policyholders reported new claims, and claims of 79
policyholders were closed, decreasing the number of active policyholders by 23 during the period. The 23 decrease
comprised 1 from 2010, (15) from 2009 and (9) from 2008. The increase of 1 from 2010 included 21 new policyholders
reporting new claims and the closing of 20 policyholders’ claims.
IBNR net reserves decreased by $72 million. As of December 31, 2010 IBNR represented 60% of total net asbestos
reserves, 2 points lower than as of December 31, 2009. IBNR provides for reserve development of known claims and
future reporting of additional unknown claims from current and new policyholders and ceding companies.
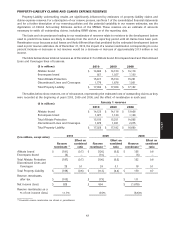
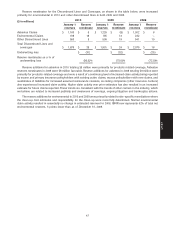
Pending, new, total closed and closed without payment claims for asbestos and environmental exposures for the
years ended December 31, are summarized in the following table.
2010 2009 2008
Number of claims
Asbestos
Pending, beginning of year 8,252 8,780 9,256
New 788 814 601
Total closed (619) (1,342) (1,077)
Pending, end of year 8,421 8,252 8,780
Closed without payment 336 469 800
Environmental
Pending, beginning of year 4,114 4,603 4,747
New 498 389 291
Total closed (315) (878) (435)
Pending, end of year 4,297 4,114 4,603
Closed without payment 181 416 307
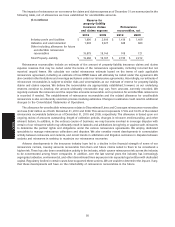
Property-Liability reinsurance ceded For Allstate Protection, we utilize reinsurance to reduce exposure to
catastrophe risk and manage capital, and to support the required statutory surplus and the insurance financial strength
ratings of certain subsidiaries such as Castle Key Insurance Company and Allstate New Jersey Insurance Company. We
purchase significant reinsurance to manage our aggregate countrywide exposure to an acceptable level. The price and
terms of reinsurance and the credit quality of the reinsurer are considered in the purchase process, along with whether
the price can be appropriately reflected in the costs that are considered in setting future rates charged to policyholders.
We also participate in various reinsurance mechanisms, including industry pools and facilities, which are backed by the
financial resources of the property-liability insurance company market participants, and have historically purchased
reinsurance to mitigate long-tail liability lines, including environmental, asbestos and other discontinued lines
exposures. We retain primary liability as a direct insurer for all risks ceded to reinsurers.
49
MD&A