Allstate 2011 Annual Report Download - page 3
Download and view the complete annual report
Please find page 3 of the 2011 Allstate annual report below. You can navigate through the pages in the report by either clicking on the pages listed below, or by using the keyword search tool below to find specific information within the annual report.-
 1
1 -
 2
2 -
 3
3 -
 4
4 -
 5
5 -
 6
6 -
 7
7 -
 8
8 -
 9
9 -
 10
10 -
 11
11 -
 12
12 -
 13
13 -
 14
14 -
15
-
16
-
17
-
18
-
19
-
20
-
21
-
22
-
23
-
24
-
25
-
26
-
27
-
28
-
29
-
30
-
31
-
32
-
33
-
34
-
35
-
36
-
37
-
38
-
39
-
40
-
41
-
42
-
43
-
44
-
45
-
46
-
47
-
48
-
49
-
50
-
51
-
52
-
53
-
54
-
55
-
56
-
57
-
58
-
59
-
60
-
61
-
62
-
63
-
64
-
65
-
66
-
67
-
68
-
69
-
70
-
71
-
72
-
73
-
74
-
75
-
76
-
77
-
78
-
79
-
80
-
81
-
82
-
83
-
84
-
85
-
86
-
87
-
88
-
89
-
90
-
91
-
92
-
93
-
94
-
95
-
96
-
97
-
98
-
99
-
100
-
101
-
102
-
103
-
104
-
105
-
106
-
107
-
108
-
109
-
110
-
111
-
112
-
113
-
114
-
115
-
116
-
117
-
118
-
119
-
120
-
121
-
122
-
123
-
124
-
125
-
126
-
127
-
128
-
129
-
130
-
131
-
132
-
133
-
134
-
135
-
136
-
137
-
138
-
139
-
140
-
141
-
142
-
143
-
144
-
145
-
146
-
147
-
148
-
149
-
150
-
151
-
152
-
153
-
154
-
155
-
156
-
157
-
158
-
159
-
160
-
161
-
162
-
163
-
164
-
165
-
166
-
167
-
168
-
169
-
170
-
171
-
172
-
173
-
174
-
175
-
176
-
177
-
178
-
179
-
180
-
181
-
182
-
183
-
184
-
185
-
186
-
187
-
188
-
189
-
190
-
191
-
192
-
193
-
194
-
195
-
196
-
197
-
198
-
199
-
200
-
201
-
202
-
203
-
204
-
205
-
206
-
207
-
208
-
209
-
210
-
211
-
212
-
213
-
214
-
215
-
216
-
217
-
218
-
219
-
220
-
221
-
222
-
223
-
224
-
225
-
226
-
227
-
228
-
229
-
230
-
231
-
232
-
233
-
234
-
235
-
236
-
237
-
238
-
239
-
240
-
241
-
242
-
243
-
244
-
245
-
246
-
247
-
248
-
249
-
250
-
251
-
252
-
253
-
254
-
255
-
256
-
257
-
258
-
259
-
260
-
261
-
262
-
263
-
264
-
265
-
266
-
267
-
268
-
269
-
270
-
271
-
272
-
273
-
274
-
275
-
276
 |
 |

2
Allstate Financial achieved its goals in the “Focus
to Win” strategy, and 2010 operating income*
was $476 million, a $136 million increase from
the prior year. We exited the annuity business
through banks and broker-dealers based on
an assessment of future returns and a desire
to have a larger portion of profits coming
from underwritten products. Allstate Benefits
continued to grow, with premiums increasing
by 33% in 2010, putting us in the number two
market share position in U.S. workplace voluntary
benefits. We recently announced the strategic
decision to wind down Allstate Bank, which,
when completed, will not subject the corporation
to thrift holding company regulation.
The investment strategies were well-executed
and timed as the market returned to more
“normal” levels. We continued to stay long on
corporate credit. As part of the risk reduction
strategy, commercial real estate holdings were
reduced by $2.3 billion of amortized cost and
municipal bond holdings were lowered by $5.5
billion of amortized cost in 2010. Given continued
economic uncertainty, hedges against declines
in equity prices and higher interest rates were
maintained throughout the year. As a result of
these actions and lower interest rates, investment
income declined by 8%, which negatively
impacted net income and return on equity.
The overall value of our portfolio, however, did
exceptionally well and moved into an unrealized
gain position from an unrealized loss, a $3.7
billion increase.
reinvention: the key to our future
Allstate is hard at work reinventing protection
and retirement for the consumer. We are
investing in “go-to-market” strategies to
differentiate us from the competition and
grow market share. Several new products
were launched, including GoodForLifeSM, which
combines life insurance with critical illness and
severe accident benefits, and Good HandsSM
Roadside Assistance, the first-ever free-to-join
roadside assistance program. In addition, two
exciting concepts, Drive WiseSM and the Allstate
Claim Satisfaction GuaranteeSM, are being tested.
Plans are also being developed to serve the
customer segment that is more self-directed and
price-sensitive than those customers attracted to
Allstate agencies.
people and culture are critical
to our success
Allstate is powered by a remarkable group of
talented individuals that come together with a
purpose and mission to help customers.
The senior leadership team provides the right
high-performance environment for 36,000
employees and 12,000 agency owners and
exclusive financial representatives. About half
of the senior team has joined us since 2007,
which, when combined with a wealth of Allstate
experience, provides breadth and depth of
leadership. The performance bar gets higher
each year and this team continues to rise to
the occasion and deliver results. You are also
well-served by an experienced board, with 10
independent directors, that utilizes leading
corporate governance practices.
improving our reputation and
community leadership
Allstate’s corporate reputation improved again
last year. By taking a stakeholder and shareholder
approach to reputation, our relative industry
position improved in 2010. Allstate also makes
a difference in the broader community. The
Allstate Foundation invests with thousands of
organizations in communities in every state,
and thousands of Allstate agency owners and
employees serve their communities every day.
Leading Allstate is a privilege and an honor. In the
year ahead, we will deliver value to shareholders
and make an even bigger difference in the lives
of those we protect. After all
—
we are The Good
Hands® People!
Thomas J. Wilson
Chairman, President and Chief Executive Officer
April 1, 2011
* For a definition of this term, please see the “Definitions of Non-GAAP
Measures” on the second page following the proxy statement.
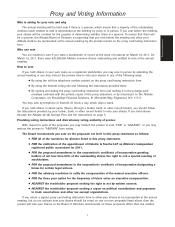
35.8
36.8
29.4
32.0
31.4
10
Revenues
($ billions)
06 07 08 09
21.8
21.9
12.6
16.7
19.0
10
Shareholders’ equity
($ billions)
06 07 08 09
34.80
38.54
23.47
30.84
35.32
10
Book value per share
($)
06 07 08 09
23.8
21.2
-9.7
5.8
5.2
10
Return on equity
(%)
06 07 08 09
7.83
7.76
-3.06
1.58
1.71
10
Net income (loss)
per diluted share
($)
06 07 08 09