Allstate 2011 Annual Report Download - page 225
Download and view the complete annual report
Please find page 225 of the 2011 Allstate annual report below. You can navigate through the pages in the report by either clicking on the pages listed below, or by using the keyword search tool below to find specific information within the annual report.-
 1
1 -
2
-
3
-
4
-
5
-
6
-
7
-
8
-
9
-
10
-
11
-
12
-
13
-
14
-
15
-
16
-
17
-
18
-
19
-
20
-
21
-
22
-
23
-
24
-
25
-
26
-
27
-
28
-
29
-
30
-
31
-
32
-
33
-
34
-
35
-
36
-
37
-
38
-
39
-
40
-
41
-
42
-
43
-
44
-
45
-
46
-
47
-
48
-
49
-
50
-
51
-
52
-
53
-
54
-
55
-
56
-
57
-
58
-
59
-
60
-
61
-
62
-
63
-
64
-
65
-
66
-
67
-
68
-
69
-
70
-
71
-
72
-
73
-
74
-
75
-
76
-
77
-
78
-
79
-
80
-
81
-
82
-
83
-
84
-
85
-
86
-
87
-
88
-
89
-
90
-
91
-
92
-
93
-
94
-
95
-
96
-
97
-
98
-
99
-
100
-
101
-
102
-
103
-
104
-
105
-
106
-
107
-
108
-
109
-
110
-
111
-
112
-
113
-
114
-
115
-
116
-
117
-
118
-
119
-
120
-
121
-
122
-
123
-
124
-
125
-
126
-
127
-
128
-
129
-
130
-
131
-
132
-
133
-
134
-
135
-
136
-
137
-
138
-
139
-
140
-
141
-
142
-
143
-
144
-
145
-
146
-
147
-
148
-
149
-
150
-
151
-
152
-
153
-
154
-
155
-
156
-
157
-
158
-
159
-
160
-
161
-
162
-
163
-
164
-
165
-
166
-
167
-
168
-
169
-
170
-
171
-
172
-
173
-
174
-
175
-
176
-
177
-
178
-
179
-
180
-
181
-
182
-
183
-
184
-
185
-
186
-
187
-
188
-
189
-
190
-
191
-
192
-
193
-
194
-
195
-
196
-
197
-
198
-
199
-
200
-
201
-
202
-
203
-
204
-
205
-
206
-
207
-
208
-
209
-
210
-
211
-
212
-
213
-
214
-
 215
215 -
 216
216 -
 217
217 -
 218
218 -
 219
219 -
 220
220 -
 221
221 -
 222
222 -
 223
223 -
 224
224 -
 225
225 -
 226
226 -
 227
227 -
 228
228 -
 229
229 -
 230
230 -
 231
231 -
 232
232 -
 233
233 -
 234
234 -
 235
235 -
236
-
237
-
238
-
239
-
240
-
241
-
242
-
243
-
244
-
245
-
246
-
247
-
248
-
249
-
250
-
251
-
252
-
253
-
254
-
255
-
256
-
257
-
258
-
259
-
260
-
261
-
262
-
263
-
264
-
265
-
266
-
267
-
268
-
269
-
270
-
271
-
272
-
273
-
274
-
275
-
276
 |
 |

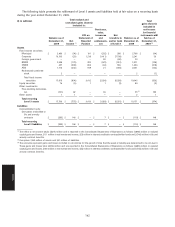
Asset-liability management is a risk management strategy that is principally employed by Allstate Financial to
balance the respective interest-rate sensitivities of its assets and liabilities. Depending upon the attributes of the assets
acquired and liabilities issued, derivative instruments such as interest rate swaps, caps, floors, swaptions and futures
are utilized to change the interest rate characteristics of existing assets and liabilities to ensure the relationship is
maintained within specified ranges and to reduce exposure to rising or falling interest rates. Allstate Financial uses
financial futures and interest rate swaps to hedge anticipated asset purchases and liability issuances and futures and
options for hedging the equity exposure contained in its equity indexed life and annuity product contracts that offer
equity returns to contractholders. In addition, Allstate Financial uses interest rate swaps to hedge interest rate risk
inherent in funding agreements.
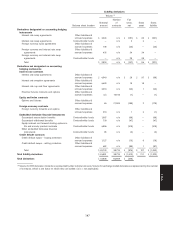
When derivatives meet specific criteria, they may be designated as accounting hedges and accounted for as fair
value, cash flow, foreign currency fair value or foreign currency cash flow hedges. Allstate Financial designates certain
of its interest rate and foreign currency swap contracts and certain investment risk transfer reinsurance agreements as
fair value hedges when the hedging instrument is highly effective in offsetting the risk of changes in the fair value of the
hedged item. Allstate Financial designates certain of its foreign currency swap contracts as cash flow hedges when the
hedging instrument is highly effective in offsetting the exposure of variations in cash flows for the hedged risk that could
affect net income. Amounts are reclassified to net investment income or realized capital gains and losses as the hedged
item affects net income.
Asset replication refers to the ‘‘synthetic’’ creation of assets through the use of derivatives and primarily investment
grade host bonds to replicate securities that are either unavailable in the cash markets or more economical to acquire in
synthetic form. The Company replicates fixed income securities using a combination of a credit default swap and one or
more highly rated fixed income securities to synthetically replicate the economic characteristics of one or more cash
market securities. The Company also creates ‘‘synthetic’’ exposure to equity markets through the use of exchange
traded equity index future contracts and an investment grade host bond.
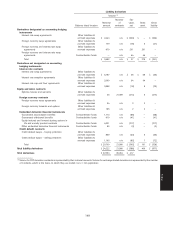
The Company’s primary embedded derivatives are conversion options in fixed income securities, which provide the
Company with the right to convert the instrument into a predetermined number of shares of common stock; equity
options in Allstate Financial life and annuity product contracts, which provide equity returns to contractholders; equity-
indexed notes containing equity call options, which provide a coupon payout that is determined using one or more
equity-based indices; and credit default swaps in synthetic collateralized debt obligations, which provide enhanced
coupon rates as a result of selling credit protection.
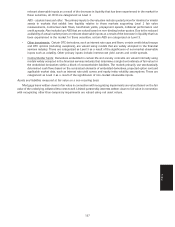
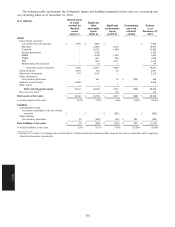
The notional amounts specified in the contracts are used to calculate the exchange of contractual payments under
the agreements and are generally not representative of the potential for gain or loss on these agreements. However, the
notional amounts specified in credit default swaps where the Company has sold credit protection represent the
maximum amount of potential loss, assuming no recoveries.
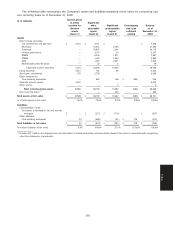
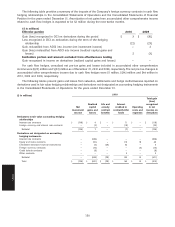
Fair value, which is equal to the carrying value, is the estimated amount that the Company would receive or pay to
terminate the derivative contracts at the reporting date. The carrying value amounts for OTC derivatives are further
adjusted for the effects, if any, of legally enforceable master netting agreements and are presented on a net basis, by
counterparty agreement, in the Consolidated Statements of Financial Position. For certain exchange traded derivatives,
the exchange requires margin deposits as well as daily cash settlements of margin accounts. As of December 31, 2010,
the Company pledged $37 million of securities and cash in the form of margin deposits.
For those derivatives which qualify for fair value hedge accounting, net income includes the changes in the fair
value of both the derivative instrument and the hedged risk, and therefore reflects any hedging ineffectiveness. For cash
flow hedges, gains and losses are amortized from accumulated other comprehensive income and are reported in net
income in the same period the forecasted transactions being hedged impact net income. For embedded derivatives in
fixed income securities, net income includes the change in fair value of the embedded derivative and accretion income
related to the host instrument. For non-hedge derivatives, net income includes changes in fair value and accrued
periodic settlements, when applicable.
145
Notes