Allstate 2011 Annual Report Download - page 231
Download and view the complete annual report
Please find page 231 of the 2011 Allstate annual report below. You can navigate through the pages in the report by either clicking on the pages listed below, or by using the keyword search tool below to find specific information within the annual report.-
 1
1 -
2
-
3
-
4
-
5
-
6
-
7
-
8
-
9
-
10
-
11
-
12
-
13
-
14
-
15
-
16
-
17
-
18
-
19
-
20
-
21
-
22
-
23
-
24
-
25
-
26
-
27
-
28
-
29
-
30
-
31
-
32
-
33
-
34
-
35
-
36
-
37
-
38
-
39
-
40
-
41
-
42
-
43
-
44
-
45
-
46
-
47
-
48
-
49
-
50
-
51
-
52
-
53
-
54
-
55
-
56
-
57
-
58
-
59
-
60
-
61
-
62
-
63
-
64
-
65
-
66
-
67
-
68
-
69
-
70
-
71
-
72
-
73
-
74
-
75
-
76
-
77
-
78
-
79
-
80
-
81
-
82
-
83
-
84
-
85
-
86
-
87
-
88
-
89
-
90
-
91
-
92
-
93
-
94
-
95
-
96
-
97
-
98
-
99
-
100
-
101
-
102
-
103
-
104
-
105
-
106
-
107
-
108
-
109
-
110
-
111
-
112
-
113
-
114
-
115
-
116
-
117
-
118
-
119
-
120
-
121
-
122
-
123
-
124
-
125
-
126
-
127
-
128
-
129
-
130
-
131
-
132
-
133
-
134
-
135
-
136
-
137
-
138
-
139
-
140
-
141
-
142
-
143
-
144
-
145
-
146
-
147
-
148
-
149
-
150
-
151
-
152
-
153
-
154
-
155
-
156
-
157
-
158
-
159
-
160
-
161
-
162
-
163
-
164
-
165
-
166
-
167
-
168
-
169
-
170
-
171
-
172
-
173
-
174
-
175
-
176
-
177
-
178
-
179
-
180
-
181
-
182
-
183
-
184
-
185
-
186
-
187
-
188
-
189
-
190
-
191
-
192
-
193
-
194
-
195
-
196
-
197
-
198
-
199
-
200
-
201
-
202
-
203
-
204
-
205
-
206
-
207
-
208
-
209
-
210
-
211
-
212
-
213
-
214
-
215
-
216
-
217
-
218
-
219
-
220
-
 221
221 -
 222
222 -
 223
223 -
 224
224 -
 225
225 -
 226
226 -
 227
227 -
 228
228 -
 229
229 -
 230
230 -
 231
231 -
 232
232 -
 233
233 -
 234
234 -
 235
235 -
 236
236 -
 237
237 -
 238
238 -
 239
239 -
 240
240 -
 241
241 -
242
-
243
-
244
-
245
-
246
-
247
-
248
-
249
-
250
-
251
-
252
-
253
-
254
-
255
-
256
-
257
-
258
-
259
-
260
-
261
-
262
-
263
-
264
-
265
-
266
-
267
-
268
-
269
-
270
-
271
-
272
-
273
-
274
-
275
-
276
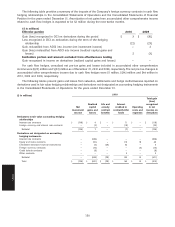
 |
 |

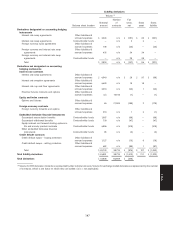
2009
Total gain
(loss)
Realized Life and Interest recognized
Net capital annuity credited to Operating in net
investment gains and contract contractholder costs and income on
income losses benefits funds expenses derivatives
Derivatives in fair value accounting hedging
relationships
Interest rate contracts $ 30 $ 12 $ — $ (13) $ — $ 29
Foreign currency and interest rate contracts — (9) — 77 — 68
Subtotal 30 3 — 64 — 97
Derivatives not designated as accounting
hedging instruments
Interest rate contracts — 255 — — — 255
Equity and index contracts — (160) — 115 24 (21)
Embedded derivative financial instruments — 122 158 (184) — 96
Foreign currency contracts — 7 — — (10) (3)
Credit default contracts — (18) — — — (18)
Other contracts (1) — — 3 — 2
Subtotal (1) 206 158 (66) 14 311
Total $ 29 $ 209 $ 158 $ (2) $ 14 $ 408
The hedge ineffectiveness reported in realized capital gains and losses amounted to gains of $7 million in 2010 and
losses of $1 million and $4 million in 2009 and 2008, respectively.
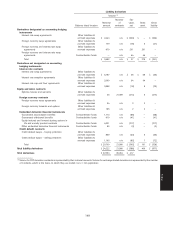
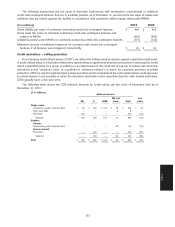
The following tables provide a summary of the changes in fair value of the Company’s fair value hedging
relationships in the Consolidated Statements of Operations for the years ended December 31.
2010
($ in millions)
Gain (loss) on
derivatives Gain (loss) on hedged risk
Foreign
Interest currency &
Location of gain or (loss) recognized rate interest rate Contractholder
in net income on derivatives contracts contracts funds Investments
Interest credited to contractholder funds $ — $ (48) $ 48 $ —
Net investment income (33) — — 33
Realized capital gains and losses 9 (2) — —
Total $ (24) $ (50) $ 48 $ 33
2009
Gain (loss) on
derivatives Gain (loss) on hedged risk
Foreign
Interest currency &
Location of gain or (loss) recognized rate interest rate Contractholder
in net income on derivatives contracts contracts funds Investments
Interest credited to contractholder funds $ (26) $ 39 $ (13) $ —
Net investment income 164 — — (164)
Realized capital gains and losses 12 (9) — —
Total $ 150 $ 30 $ (13) $ (164)
The Company manages its exposure to credit risk by utilizing highly rated counterparties, establishing risk control
limits, executing legally enforceable master netting agreements (‘‘MNAs’’) and obtaining collateral where appropriate.
151
Notes