Zynga 2015 Annual Report Download - page 99
Download and view the complete annual report
Please find page 99 of the 2015 Zynga annual report below. You can navigate through the pages in the report by either clicking on the pages listed below, or by using the keyword search tool below to find specific information within the annual report.-
 1
1 -
2
-
3
-
4
-
5
-
6
-
7
-
8
-
9
-
10
-
11
-
12
-
13
-
14
-
15
-
16
-
17
-
18
-
19
-
20
-
21
-
22
-
23
-
24
-
25
-
26
-
27
-
28
-
29
-
30
-
31
-
32
-
33
-
34
-
35
-
36
-
37
-
38
-
39
-
40
-
41
-
42
-
43
-
44
-
45
-
46
-
47
-
48
-
49
-
50
-
51
-
52
-
53
-
54
-
55
-
56
-
57
-
58
-
59
-
60
-
61
-
62
-
63
-
64
-
65
-
66
-
67
-
68
-
69
-
70
-
71
-
72
-
73
-
74
-
75
-
76
-
77
-
78
-
79
-
80
-
81
-
82
-
83
-
84
-
85
-
86
-
87
-
88
-
 89
89 -
 90
90 -
 91
91 -
 92
92 -
 93
93 -
 94
94 -
 95
95 -
 96
96 -
 97
97 -
 98
98 -
 99
99 -
 100
100 -
 101
101 -
 102
102 -
 103
103 -
 104
104 -
 105
105 -
 106
106 -
 107
107 -
 108
108 -
 109
109 -
110
-
111
-
112
-
113
-
114
-
115
-
116
-
117
-
118
-
119
-
120
-
121
-
122
-
123
-
124
-
125
-
126
-
127
-
128
-
129
-
130
-
131
-
132
-
133
-
134
-
135
-
136
-
137
-
138
-
139
-
140
-
141
-
142
-
143
-
144
-
145
-
146
-
147
-
148
-
149
-
150
-
151
 |
 |

Table of Contents
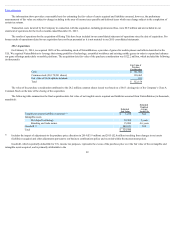
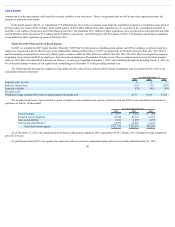
liability may be reduced by any foreign income taxes previously paid on these earnings. As of December 31, 2015, the cumulative amount of earnings upon which
U.S. income taxes have not been provided is approximately $19.7 million.
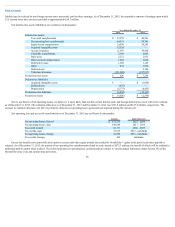
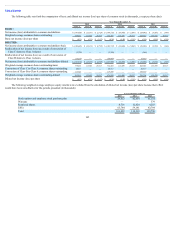
Our deferred tax assets (liabilities) are as follows (in thousands):
Year Ended December 31,
2015 2014
Deferred tax assets:
Tax credit carryforwards $ 47,978 $ 40,501
Net operating loss carryforwards 44,551 30,381
Equity based compensation 24,930 28,263
Acquired intangible assets 13,524 —
Accrued expenses 11,593 19,406
Charitable contributions 3,930 2,047
State taxes 2,321 2,933
Other accrued compensation 1,664 6,664
Deferred revenue 1,309 1,129
Other 434 1,956
Deferred rent — 2,186
Valuation allowance (151,808) (127,917)
Net deferred tax assets $ 426 $ 7,549
Deferred tax liabilities:
Acquired intangible assets $ — $ (1,654)
Deferred rent (675) —
Depreciation (5,777) (8,453)
Net deferred tax liabilities (6,452) (10,107)
Net deferred taxes $ (6,026) $ (2,558)
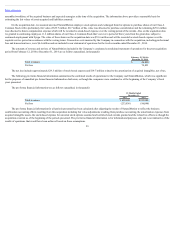
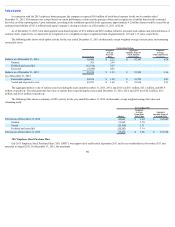
Due to our history of net operating losses, we believe it is more likely than not that certain federal, state, and foreign deferred tax assets will not be realized
as of December 31, 2015. The valuation allowance as of December 31, 2015 and December 31, 2014 was $151.8 million and $127.9 million, respectively. The
increase in valuation allowance for 2015 is primarily related to net operating losses generated and acquired during the current year.
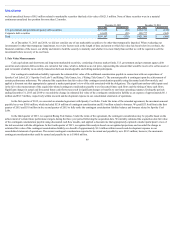
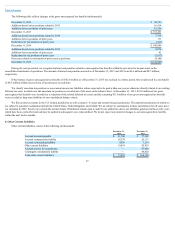
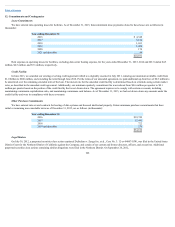
Net operating loss and tax credit carryforwards as of December 31, 2015 are as follows (in thousands):
Amount Expiration years
Net operating losses, federal $ 372,373 2027 - 2035
Net operating losses, state 340,888 2017 - 2035
Tax credit, federal 82,111 2030 - 2035
Tax credits, state 72,615 2019 - indefinite
Net operating losses, foreign 44,398 2033 - indefinite
Tax credits, foreign 443 indefinite
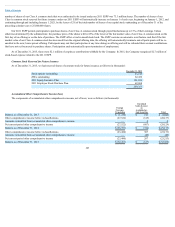
Excess tax benefits associated with stock option exercises and other equity awards are credited to stockholders’ equity in the period cash taxes payable is
reduced. As of December 31, 2015, the portion of net operating loss carryforwards related to stock awards is $472.3 million, the benefit of which will be credited to
additional paid-in capital when realized. The federal and state net operating loss carryforwards are subject to various annual limitations under Section 382 of the
Internal Revenue Code and similar state provisions.
96